
KINGSTON, NY – The Center for the Environment Sciences and Humanities at Bard College is pleased to announce the findings of the Kingston Air Quality Initiative (KAQI) after three consecutive years of research and data collection.
City of Kingston, NY Press Release – 6/2/2023
Bard College Press Release – 6/5/2023
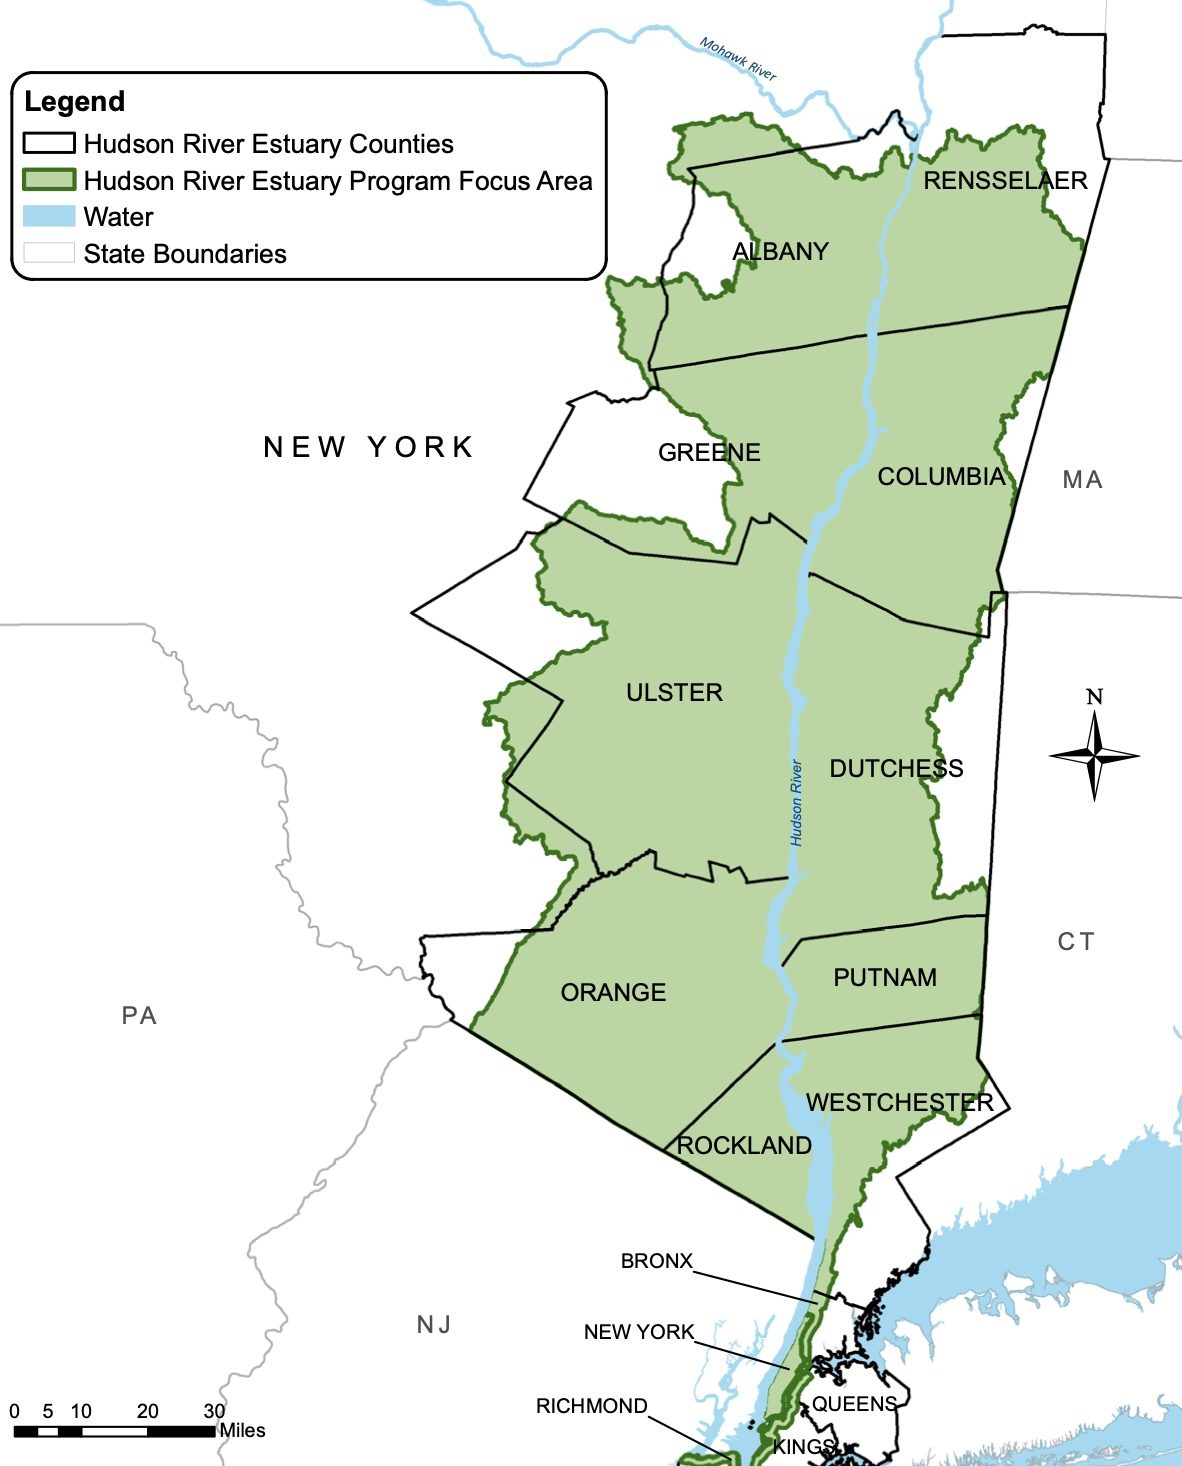
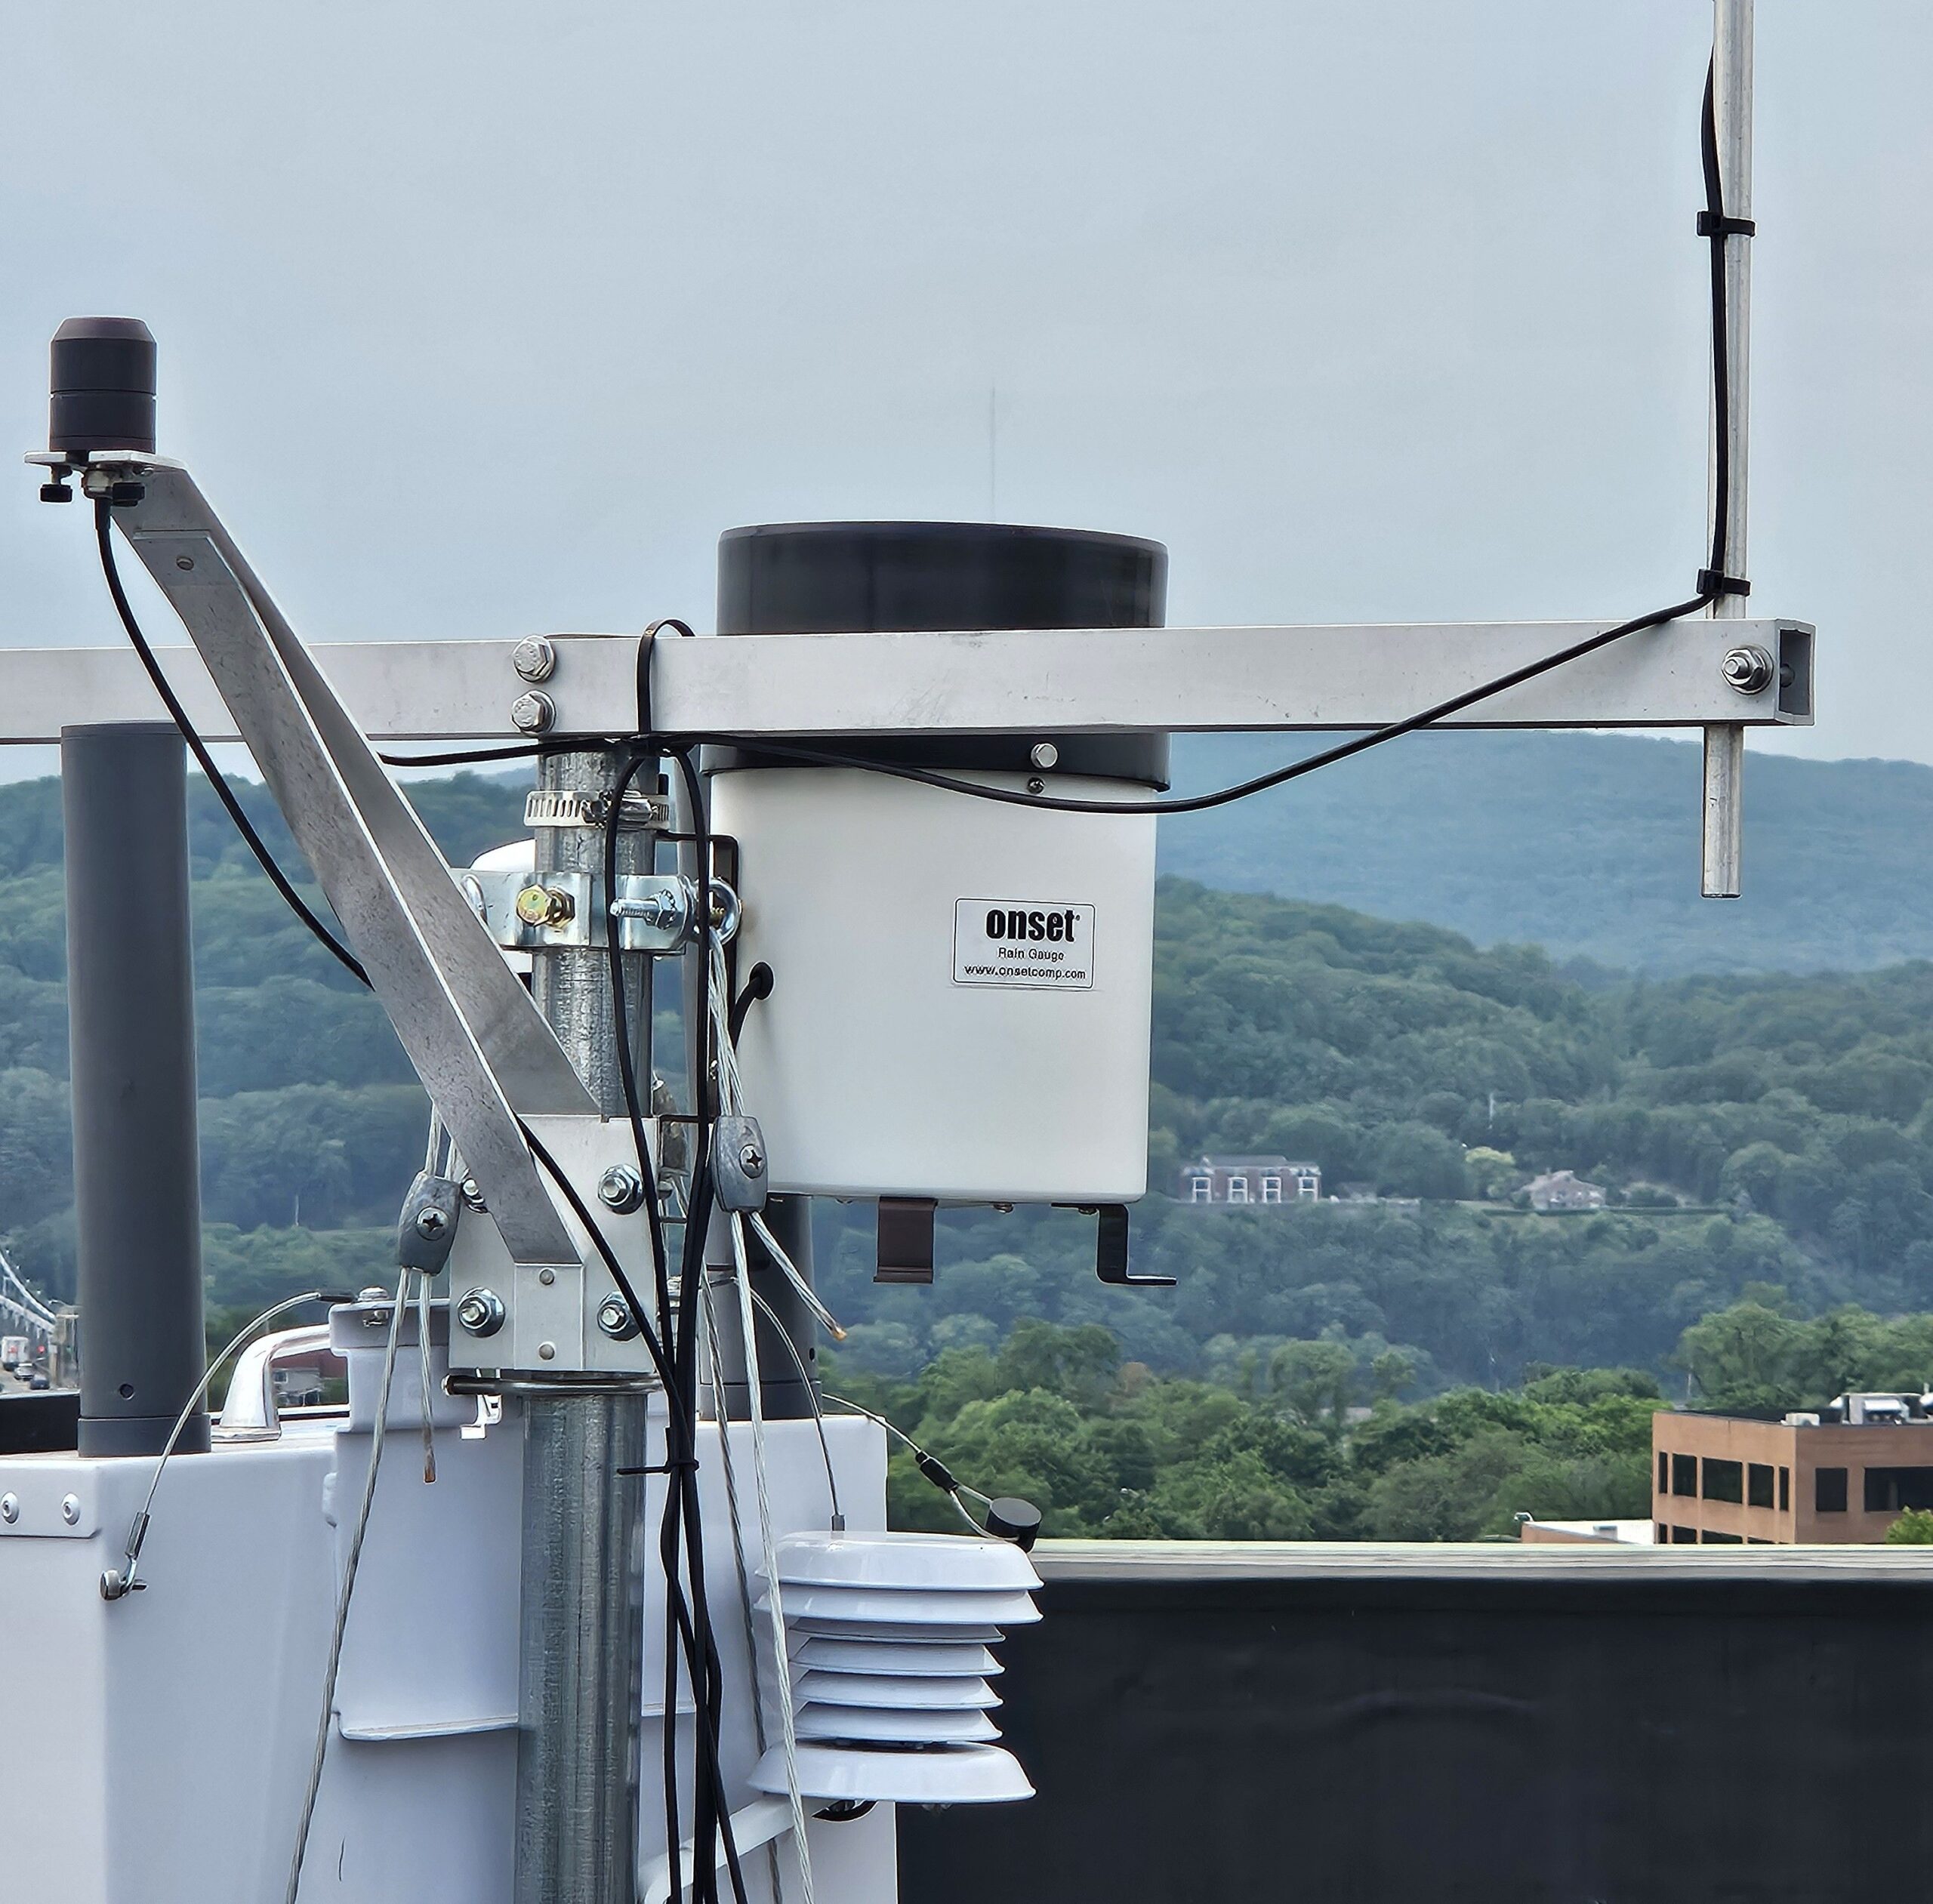
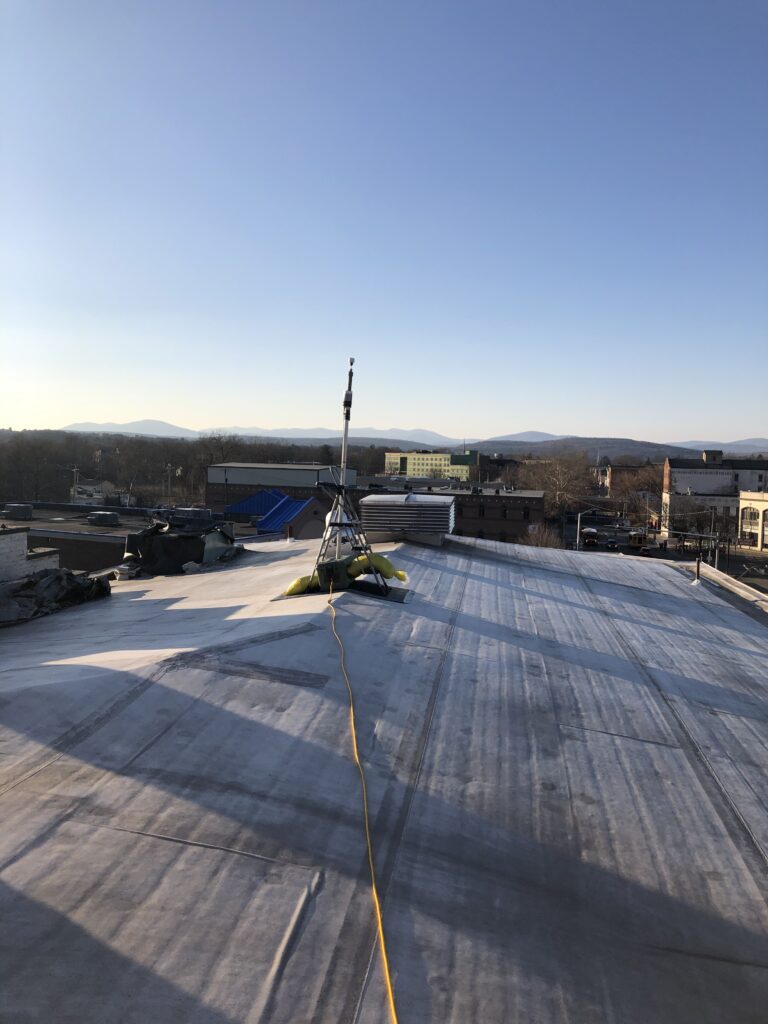
KAQI began in January 2020 as a partnership between Bard’s Community Sciences Lab and the City of Kingston Conservation Advisory Council’s Air Quality Subcommittee. Since then, Kingston residents and Bard College students, staff, and faculty have facilitated both indoor and outdoor air quality monitoring projects throughout Ulster County. Standing as the first air quality study of its kind in Kingston, KAQI’s monitoring efforts focus on a regional assessment of air pollution as measured from the roof of the Andy Murphy Neighborhood Center on Broadway in Kingston.
PM 2.5 (<2.5μm particulate matter) is made up of microscopic particles that are the products of burning fuel, and is released into the air through exhausts from oil burners, gas burners, automobiles, cooking, grilling, and both indoor and outdoor wood burning. PM 2.5 particles are so tiny, they stay suspended in the air for long periods of time, allowing them to travel long distances before depositing. When these particles are inhaled, they can enter the bloodstream through the lungs, creating or exacerbating health issues. The World Health Organization (WHO) states that “small particulate pollution has health impacts even at very low concentrations – indeed no threshold has been identified below which no damage to health is observed.”
Through the National Ambient Air Quality Standards (NAAQS), the Environmental Protection Agency (EPA) has set both primary and secondary PM2.5 thresholds with primary standards described as providing “public health protection, including protecting the health of ‘sensitive’ populations such as asthmatics, children, and the elderly” and secondary standards providing “public welfare protection, including protection against decreased visibility and damage to animals, crops, vegetation, and buildings”. The current primary and secondary EPA standards for PM2.5 are 12.0 μg/m3 and 15.0 μg/m3 annually, and 35 μg/m3 within a 24-hour period. As of January 2023, a revision was proposed to change the primary public health based annual standard from its current level of 12.0 μg/m3 to the range of 9.0-10.0 μg/m3. This revision would lean closer toward, but not come close to meeting, the WHO’s PM2.5 annual standard of 5 μg/m3 . Based on the EPA annual mean calculations, the PM2.5 annual averages for each year as measured atop the Andy Murphy Neighborhood Center are 4.157 μg/m3 in 2020, 4.896 μg/m3 in 2021, and 4.496 μg/m3 in 2022. Although below both the existing and proposed revision of the EPA annual standards, these values come close to exceeding the WHO annual standard.

Figure 1. Andy Murphy Neighborhood Center (AMNC) PM2.5 annual means from 2020-2022, calculated using the EPA’s annual mean calculations as described in Appendix N Part 50 Section 4.4. Dashed lines represent both EPA and WHO annual PM2.5 standards, as well as a gray bar visualizing the EPA’s proposed revision.
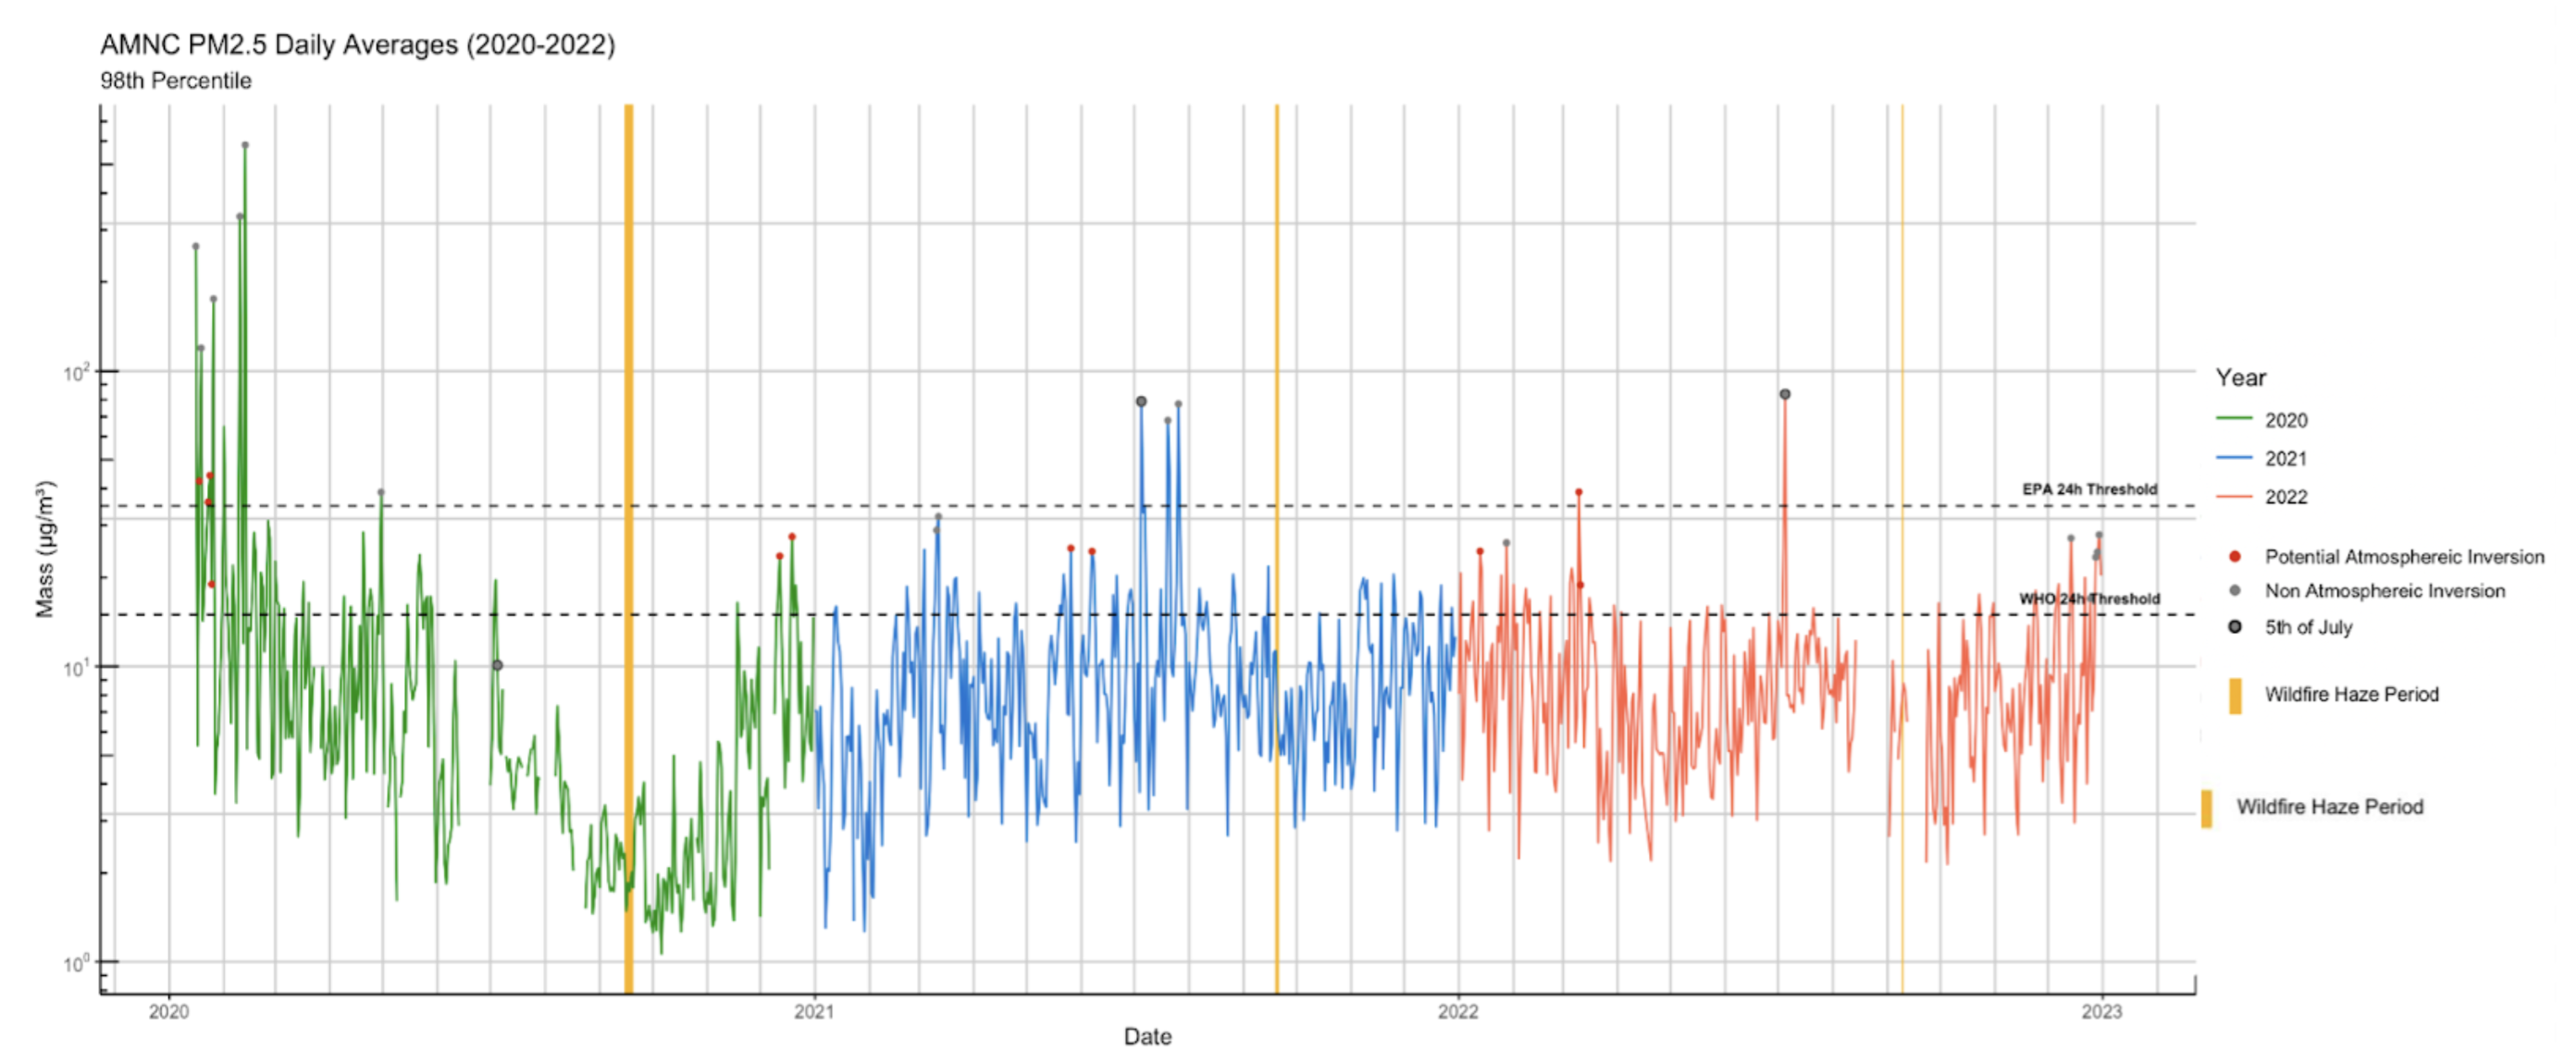
Figure 2. 98th percentile daily means from 2020-2022 on a log10 scale, with each year denoted by a different color line. These data can be directly compared to the EPA 24 hour threshold of 35 µg/m³, and are an underestimate of the 99th percentile calculation used by the WHO 24 hour threshold of 15 µg/m³, both of which are visualized by black dashed lines. Out of all peaks analyzed, gray points did not show potential atmospheric inversion risk, while red points are dates identified as potential atmospheric inversions based on mesonet data from Albany, NY. In addition, yellow bars represent potential haze periods when exterior wildfire smoke plumes may have traveled as far east as the Hudson Valley.
After 3 years of monitoring in Kingston, we are now able to see air quality trends associated with our daily activities and decisions as citizens. First, air pollution in Kingston is variable and seems to have a seasonal context – higher levels of pollution during colder months (associated with heating fuel burning (oil, wood, gas)), and lower levels in Spring/Summer, with the exception of the fireworks that were set off to celebrate 4th of July. The difference between 2020, when COVID shut things down, and the following 2 years, is pretty obvious. Fewer cars on the road and less industry in general really decreased particulates in our air.
One factor associated with many high PM2.5 events breaching the WHO threshold is the development of atmospheric inversions, which are denoted by red points in the figure above. Atmospheric inversions occur when the temperature of the atmosphere increases instead of decreases with altitude, inhibiting vertical mixing. In an event of an inversion, surface level air parcels are unable to rise up into the tropopause, therefore trapping any present air pollution at ground level. Although not all points above the WHO threshold were analyzed for a potential inversion presence, almost half of those that were did show high inversion potential. Being in the Hudson Valley, Kingston is more susceptible to inversion events as the air is blocked from all directions. It’s possible that, if Kingston citizens were aware of when these events are occurring, we could start making different decisions about woodburning and car use during these times to make our air cleaner for all.
Another potential factor influencing our air encompasses pollutants associated with smoke sourced from wildfires on the West Coast. Known pollutants attributed to wildfires include carbon monoxide (CO), nitrogen oxides (NOx), ozone (O3), volatile organic compounds (VOCs), particulate matter (PM), and black carbon. Kingston residents, as well as those throughout the greater Hudson Valley area, observed blankets of smoke at ground level at numerous points over the last three years, with the most memorable occurring the week of July 20th, 2021 and (https://www.kingston-ny.gov/wildfires). Although it is difficult to prove that the higher PM2.5 counts seen in July of 2021 were caused by wildfire smoke that had migrated across the country to the Hudson Valley, it is an important contributor to keep in mind, especially with the increasing potential for wildfire seasons to increase in length and intensity in the coming years due to the effects of climate change.
“Clean air is something we often take for granted in the Hudson Valley. Our findings show that meeting annual EPA standards (particularly current standards) is one thing, but on a day-to-day basis, our air quality is sometimes degraded and can be unhealthy. After all, we are not breathing on an average yearly basis – we are breathing on a second-by-second basis. I think it’s exciting to know that we, as a community, can make daily decisions that change our air quality. This means we can make decisions as a community to keep our own air clean – for example, we could reduce or even stop our wood-burning in city limits (particularly on days with atmospheric inversions), reduce our car use, and make our homes more energy efficient.”
Eli Dueker, Co-Director of Bard’s Center for the Environment Sciences and Humanities
“While our annual averages meet EPA standards, as many residents of Kingston and the surrounding areas know, air quality at ground level can vary widely from neighborhood to neighborhood. The average adult takes in 1000 breaths per hour, and exposures to dangerous fine particulate matter very much depend on whether wood is being burned nearby, as burning wood is dirtier and more polluting than burning oil, gas, or coal. There is no safe level of exposure to PM 2.5, so the expanding neighborhood-level monitoring efforts of the Bard Community Science Lab will help residents understand the actual air quality right where they are breathing, so we can all make choices that benefit both our health and that of the planet.”
Lorraine Farina, KAQI co-founder, Hudson Valley Air Quality Coalition co-founder, and former Kingston CAC air quality sub-committee chair.
“I want to thank Bard and the Community Sciences Lab for allowing Kingston to participate in this initiative. I am pleased to see that our air quality is superior to many of the places around us, but it’s a profound reminder that our daily activities do impact our health, and the health of our environment. We appreciate Bard’s investment in monitoring Kingston’s air, as it has been an invaluable learning tool. Together with Kingston’s Conservation Advisory Council, we will continue to monitor local air quality alerts, and will continue to work together with leaders in our region on policy and initiatives for cleaner air.”
Steve Noble, Kingston Mayor.
The Center for the Environment Sciences and Humanities at Bard College, in collaboration with KAQI, has been working on a handful of air quality related projects centralized around community needs and concerns. These include:
- Developing a publicly-accessible atmospheric inversion monitoring system for Kingston area.
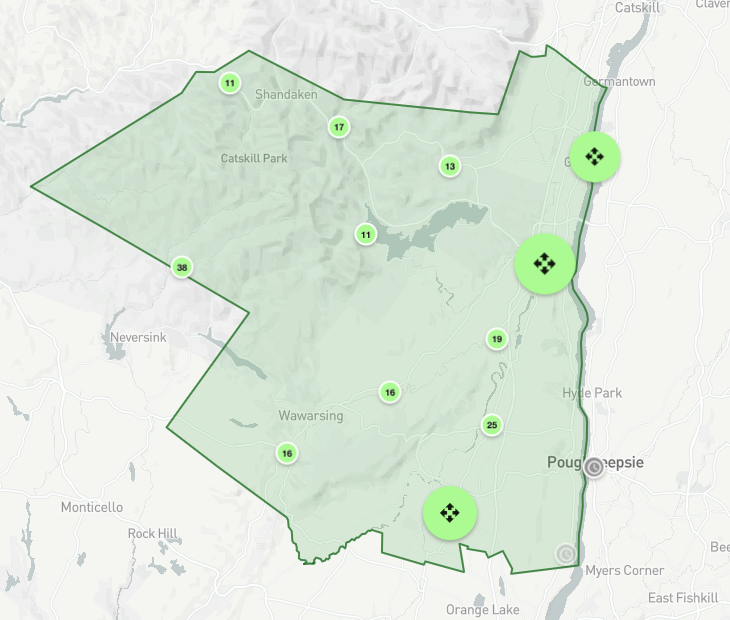
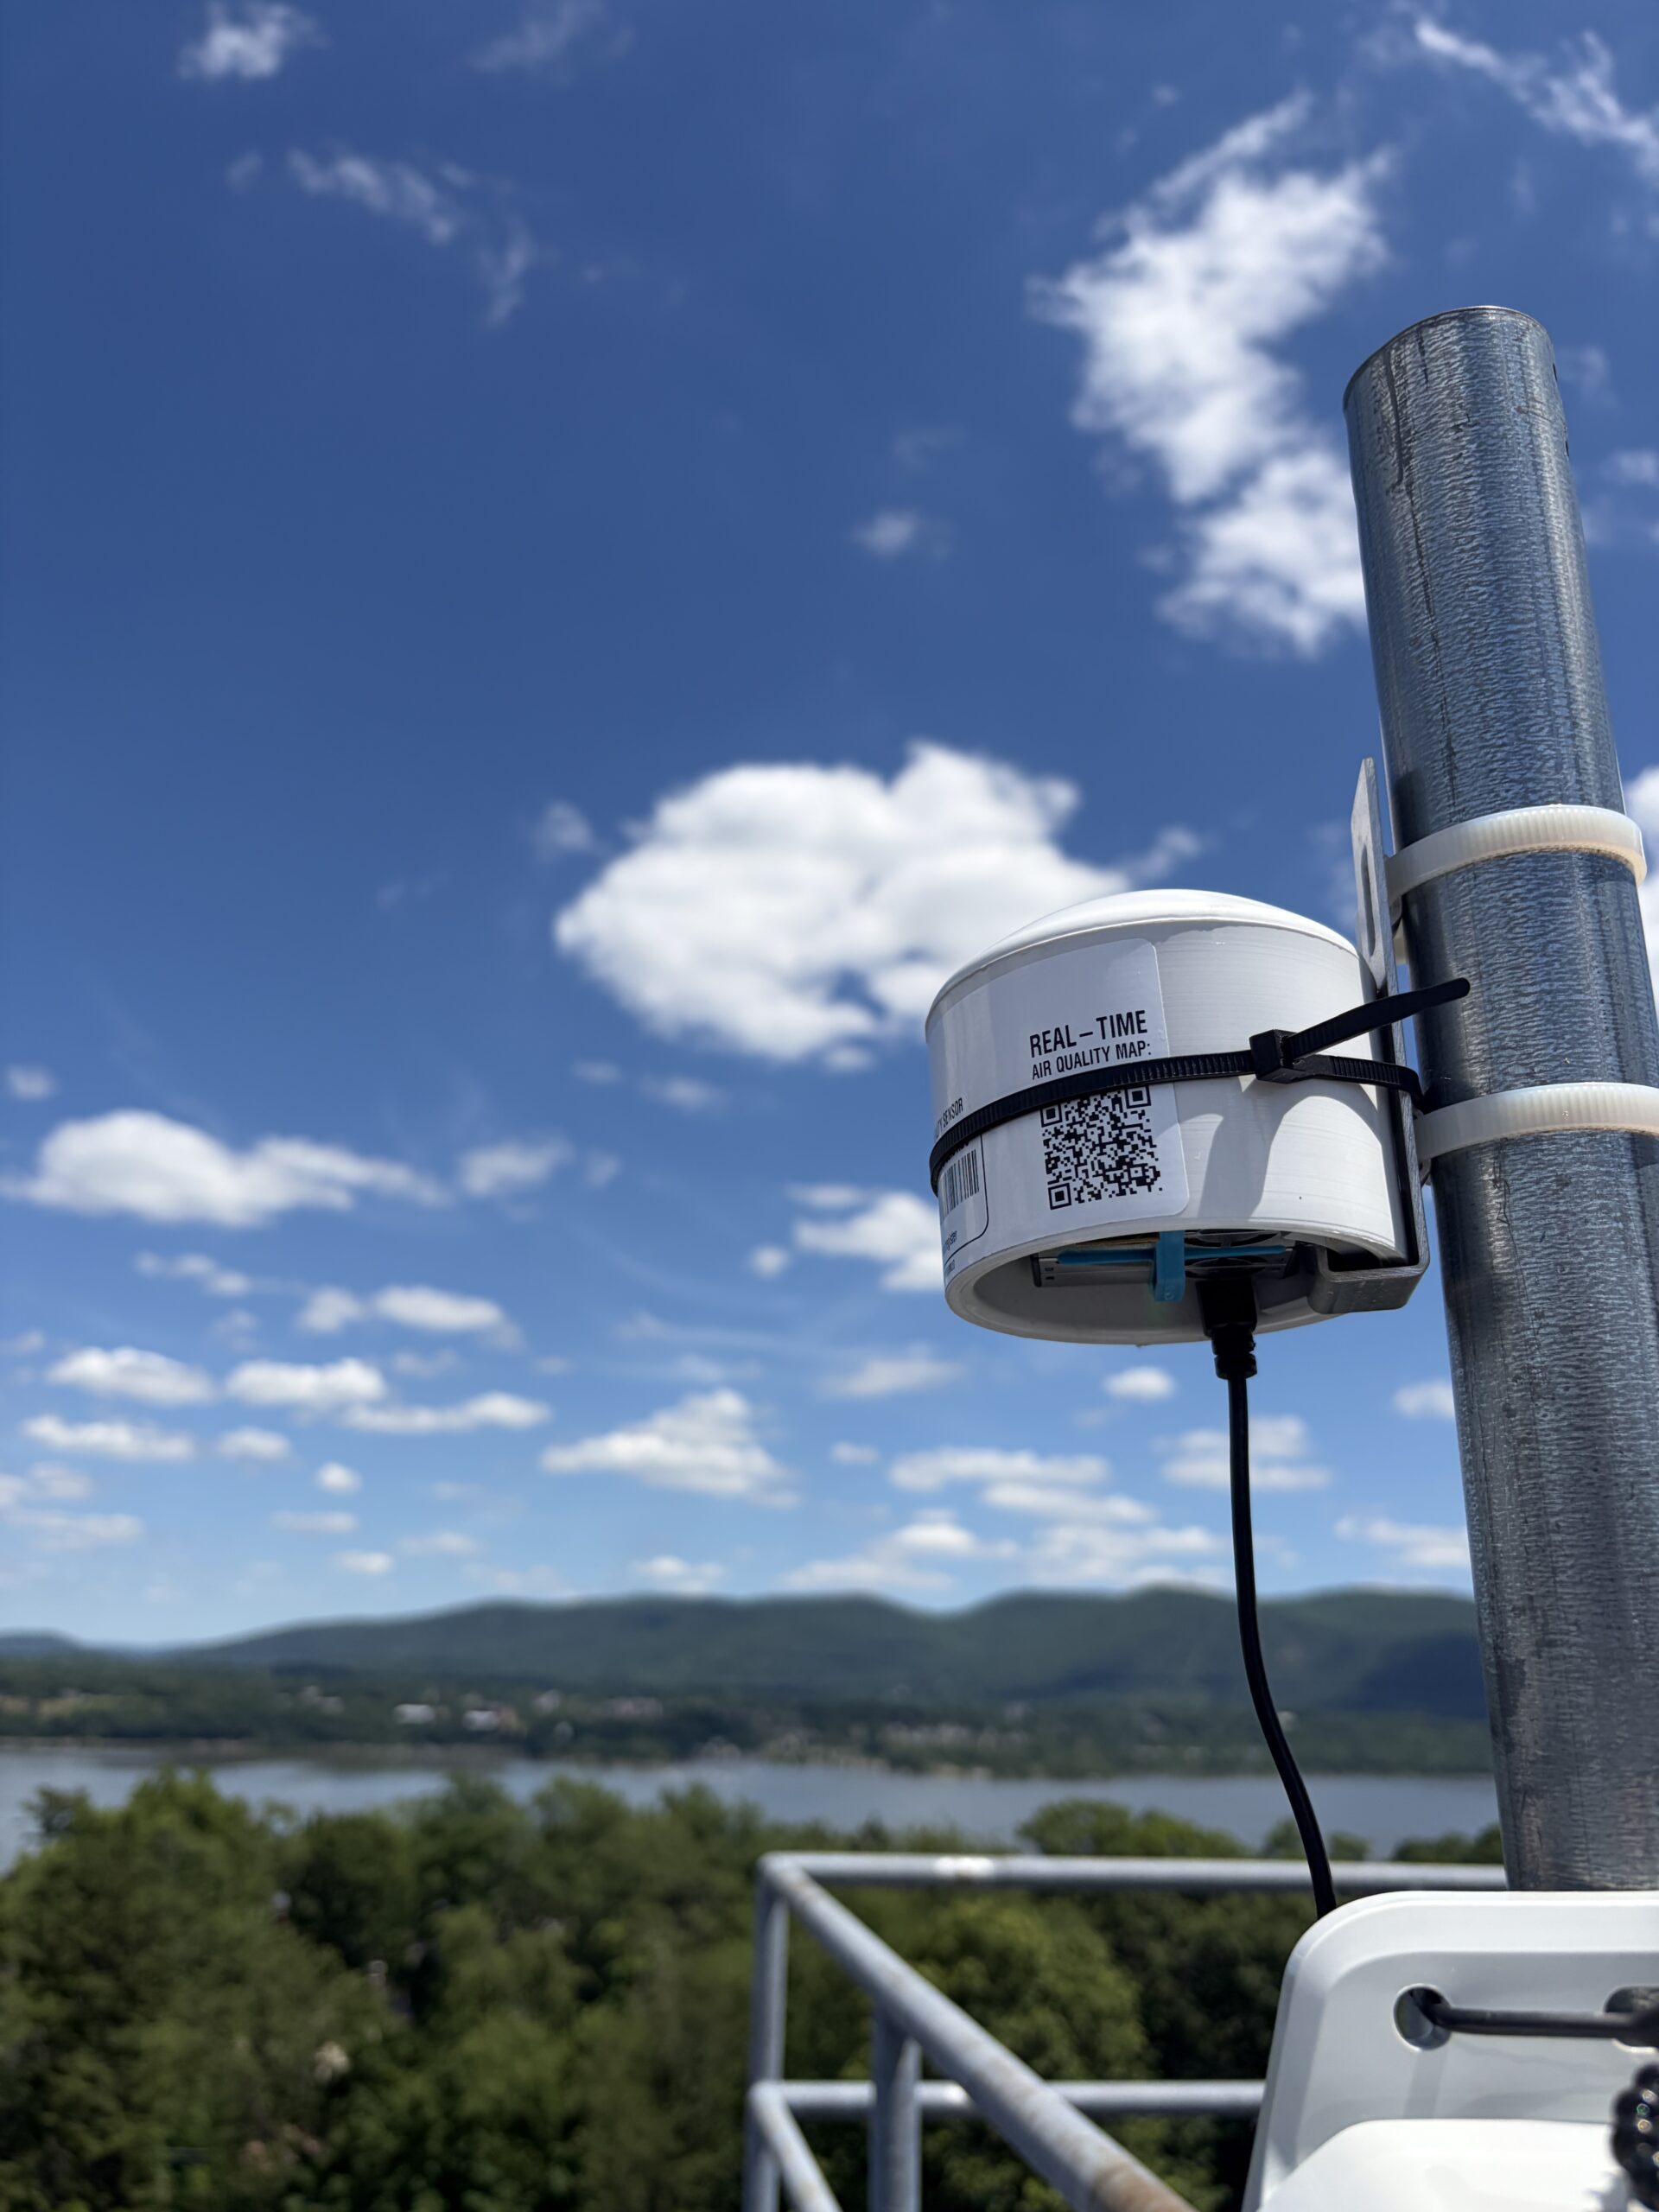
- Neighborhood-level air quality monitoring, through the fast-developing Hudson Valley Library Air Quality Network. Using outdoor real-time air quality monitoring devices stationed at public libraries, air quality data is free and accessible online. We are always looking for new locations throughout the Hudson Valley to add to the network and provide more localized data for residents. If any libraries are interested please reach out to [email protected].
- In partnership with SUNY-Albany, conducting indoor and outdoor air quality monitoring in homes with woodsmoke, mold and structurally-related air quality challenges.
For more information or ways to get involved, visit
kingston-ny.gov/airquality
cesh.bard.edu/kingston-air-quality-initiative-kaqi/
Additional resources:
Particle Pollution
Even Low Levels of Soot Can Be Deadly to Older People, Research Finds
Ambient (outdoor) air pollution
Post Date: 05-24-2023