The Community Sciences Lab was created to support the work conducted by the Center for Environmental Sciences and Humanities. Built on the success of the Bard Water Lab and its partnership with the Saw Kill Watershed Community (SKWC), CSL expands the Center’s reach by allowing us to refocus our work on projects that address the interconnectedness of land, air, water, and communities. The work of the Bard Water Lab and its goal of bringing water science to water communities continues through the Saw Kill Monitoring Program, as a CSL project.
The Bard Center for Environmental Sciences and Humanities takes research outside the lab, connecting with grassroots efforts to protect the environment and offering students opportunities to work in an interdisciplinary way. Our goal is to develop accessible, applicable, community-centered solutions to local and regional environmental problems. Currently, we tackle these problems in courses throughout the College, in faculty-directed student research, and through community- and student-run environmental monitoring programs.
The Community Sciences Lab analyzes water samples for sewage-indicating bacteria, turbidity, chlorophyll a, colored dissolved organic material, phycocyanin, and optical brighteners. We also have volunteers record temperature and conductivity data while sampling. These water quality indicators are interrelated: a change in one indicator impacts all the others. By analyzing each indicator, we’re able to monitor this complex relationship.
The Enterolert and Colilert assays are used to measure Enterococci, and Total Coliforms and Escherichia coli (E. coli), respectively.
Total coliforms include bacteria found in soil, surface waters, and human and animal waste. Fecal coliforms are a group of bacteria found in the digestive tracts of warm-blooded animals, including humans, and are excreted in feces. Within the fecal coliform group, E. coli is the best indicator of fecal pollution and the possible presence of pathogens. The Enterococcus group is also common in the intestinal tracts of warm-blooded animals, including humans, and is another important indicator of water contamination. Although many of these bacteria are not harmful and are part of a normal digestive system, fecal bacteria are correlated with swimming-associated gastrointestinal illness and are important to monitor in areas where people will be swimming or drinking the water.
Sources of fecal-indicating bacteria include wastewater treatment plant effluent, leaking septic systems, stormwater runoff, sewage from recreational boats, agricultural, domestic, or wild animal waste, improper land application of manure or sewage, and runoff from manure storage areas, pastures, rangelands, and feedlots. However, tracing the specific source of fecal bacteria contamination is complex. Information about the watershed, land uses, and pollution sources must be correlated with data on rainfall, stormwater management systems, and ecological systems. The potential human health risks vary depending on the source of bacteria and the type and number of associated pathogens.
The EPA recommends that Enterococci levels within surface waters used for recreational purposes, such as swimming, should not exceed 60 colony forming units (cfu) per 100mL of water.
Turbidity is a measure of particles suspended in water; it is measured in NTRs (nephelometric turbidity units) or JTRs (Jackson turbidity units).
The presence of minute particles in water diminishes its clarity. Turbidity increases from stormwater runoff in eroded areas, the removal of stream-bank vegetation, in-stream dredging and other disturbances, waste discharges, excess algae, decaying organic materials, and debris in streams. Suspended sediment particles create turbidity and provide surfaces for the attachment of disease-causing organisms and contaminants such as heavy metals (e.g. cadmium, zinc, mercury, lead, and chromium). These contaminants may accumulate in the food chain or concentrate on the bottom of the water body as particles settle.
Water that is highly turbid loses the capacity to support aquatic life. Elevated turbidity reduces the amount of light available for photosynthesis and decreases aquatic vegetation and food for invertebrates and fish. Furthermore, water temperature increases as suspended particles absorb heat from the sun, lowering dissolved oxygen levels. Fine particles cling to the gills of fish and filter-feeding organisms, reducing growth rates, increasing susceptibility to disease, and impairing egg and larvae development. On the stream bottom, settled particulates may smother newly hatched larvae or stream insects that in turn provide food for fish.
The degree to which turbidity affects aquatic systems and organisms depends on both the amount of sediment in the water and how long the turbidity lasts. For example, a study reported in the North American Journal of Fisheries Management indicates that fish start to show signs of stress at 10- to 100 NTUs. As NTUs increase to 10,000 and exposure increases from hours to days, fish abandon cover, show increased respiration, reduced feeding rates, and increased coughing. As exposures from 10- to 100,000 NTUs lengthen into weeks, fish show reduced growth rates, delayed hatching, and long- term reduced feeding success. Long term exposure to 500- to 100,000 NTUs can kill fish. Higher turbidity is also associated with higher levels of disease-causing microorganisms such as viruses, parasites, and bacteria.
Chlorophyll allows plants (including algae) to photosynthesize, that is, to use sunlight to convert simple molecules into organic compounds.
Chlorophyll a is the predominant type of chlorophyll found in green plants and algae. Chlorophyll a is a measure of the amount of algae growing in a water body. It can be used to classify the trophic condition of a water body. Although algae are a natural part of freshwater ecosystems, too much algae can cause aesthetic problems such as green scums and bad odors, and can result in decreased levels of dissolved oxygen. Some algae also produce toxins that can be of public health concern when they are found in high concentrations.
One of the symptoms of degraded water quality condition is the increase of algae biomass as measured by the concentration of chlorophyll a. Waters with high levels of nutrients from fertilizers, septic systems, sewage treatment plants and urban runoff may have high concentrations of chlorophyll a and excess amounts of algae.
Normal temperature ranges vary among lakes, streams, and rivers depending on geography and climate.
Water temperature also changes during daily and seasonal cycles, and weather events. The presence of bank vegetation, especially trees and shrubs that extend over the water, helps maintain a lower water temperature. Warmer water encourages algal blooms, changes metabolic rates in aquatic organisms, and affects water chemistry. In particular, dissolved oxygen decreases as water temperature increases. Changes in water temperature can also affect how chemical contaminants interact with and affect aquatic life.
Aquatic plants and animals have different tolerances for characteristics such as temperature, pH and dissolved oxygen. Aquatic organisms thrive at optimum temperatures according to species and can only survive at their “maximum” temperature for a few hours. At certain life cycle stages like spawning, fish have different temperature requirements. For example, the optimum temperature for spawning is 77 degrees Fahrenheit for the bluegill sunfish, and 48 degrees for the brook trout. The bluegill can tolerate a short-term maximum of 95 degrees, while the trout can tolerate a maximum of only 75.
Salt (sodium chloride) content in fresh water is assessed by measuring chlorides—soluble mineral compounds dissolved in water—in milligrams per liter (mg/L) of water.
However, salt content can also be measured through conductivity. Conductivity is the ability of water to conduct an electrical current through charged particles within the water. These particles include salts, minerals, chlorides, sulfides, and carbonate compounds. Values are reported in microsiemens per centimeter (uS/cm). “Specific conductance” measures conductivity at specific water temperatures. Changes in the water’s salt content (measured by chlorides or conductivity) can be an early indicator of changes in water quality. Polluted water usually has a higher specific conductance than unpolluted water. High specific conductance values often indicate pollution from road salt, septic systems, wastewater treatment plants, or urban/agricultural runoff. When streamflow is low, the concentration of salt is proportionately higher, with a corresponding increase in its potential to harm aquatic life.
A high concentration of salt renders water undrinkable, kills freshwater organisms, corrodes plumbing fixtures, and damages agricultural crops. Increased salinity affects the type of plants and aquatic organisms that can thrive in a particular lake or stream, becoming harmful to these organisms when salt levels exceed species’ tolerance range.
EPA has recommended that sodium levels in water not exceed 20 milligrams per liter (mg/L) for individuals on no-salt diets. The EPA Secondary Drinking Water Regulations recommend a maximum concentration of 250 mg/L for chloride ions (i.e. salts) in order to maintain a healthy ecosystem and safe drinking water.
Bard Water Lab Turbidimeter Protocol
Quality Control Notes
Bard Water Lab Fluorometer Protocol
Important Notes
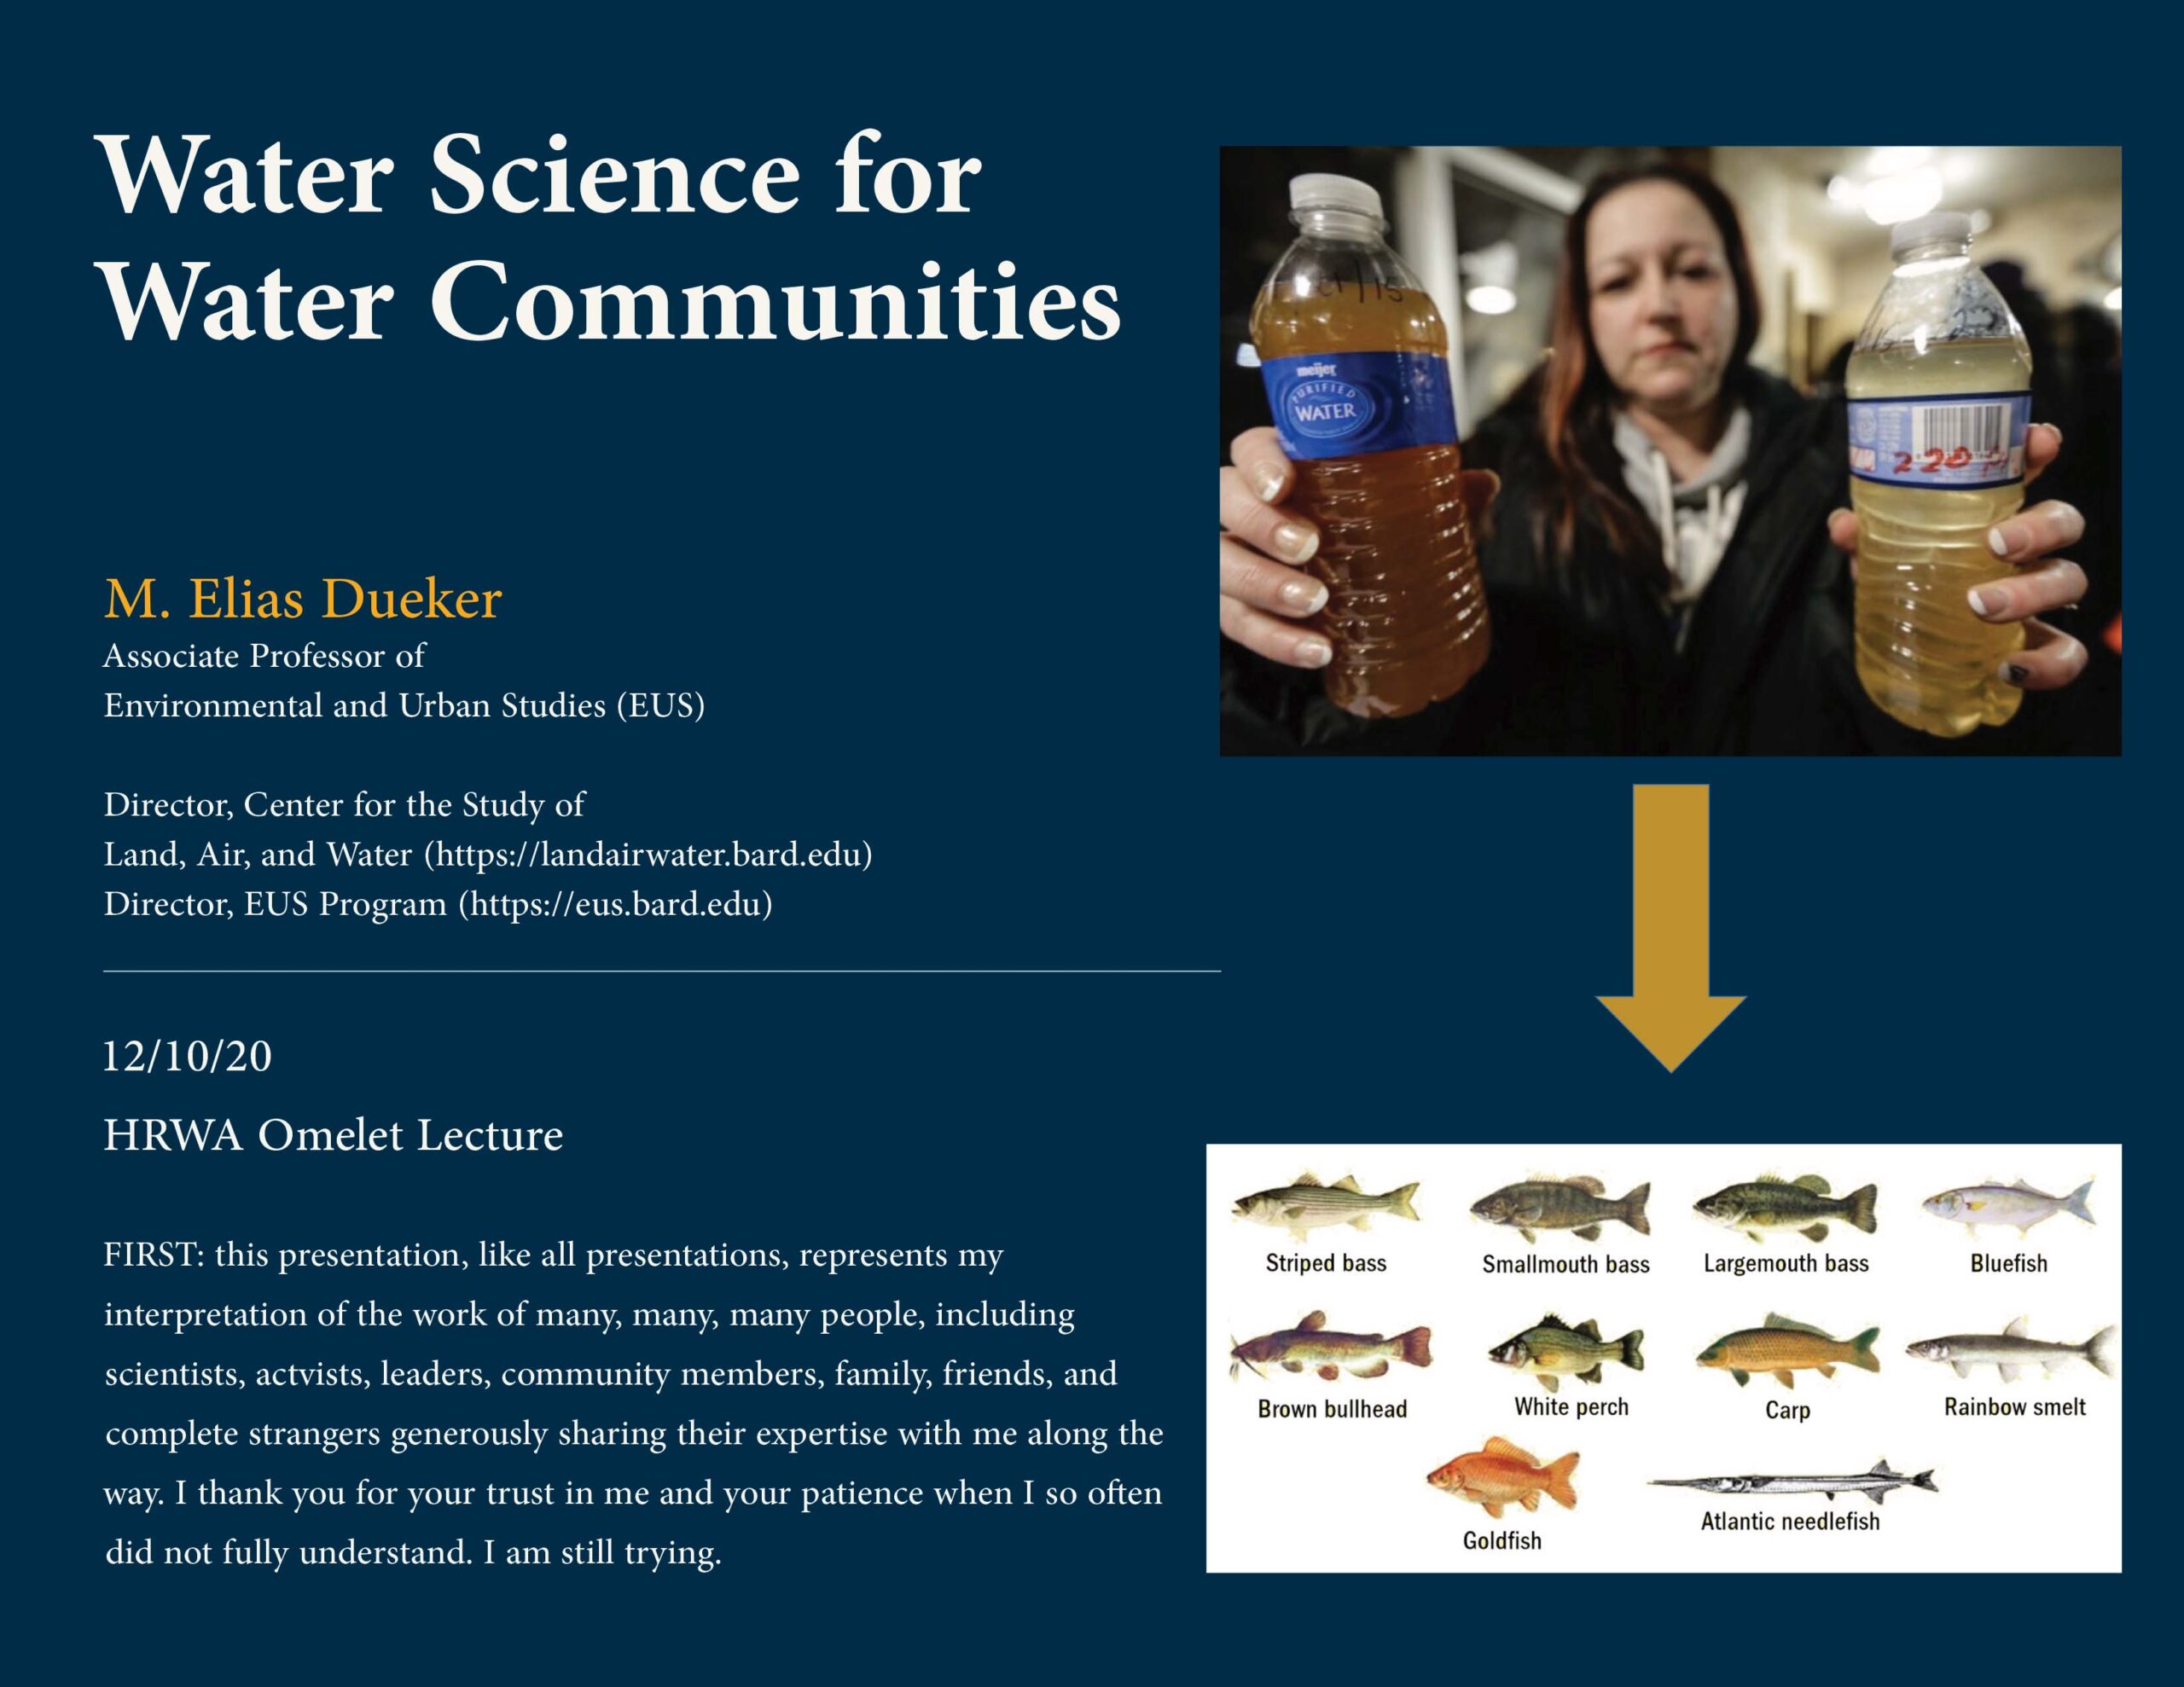
What do we need right now to advance water stewardship in the Hudson Valley? More water sampling? More community involvement? More laws? Science can be used as a tool to address many of these important questions, and help map a way forward in these complicated times. M. Elias Dueker, the Center’s director, presents a framework for community-centered science in this webinar hosted by the Hudson River Watershed Alliance.