
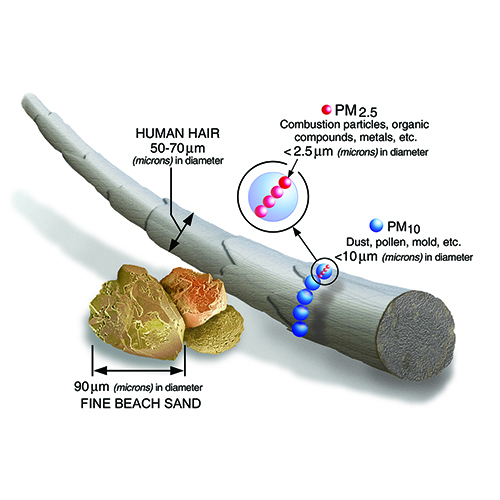
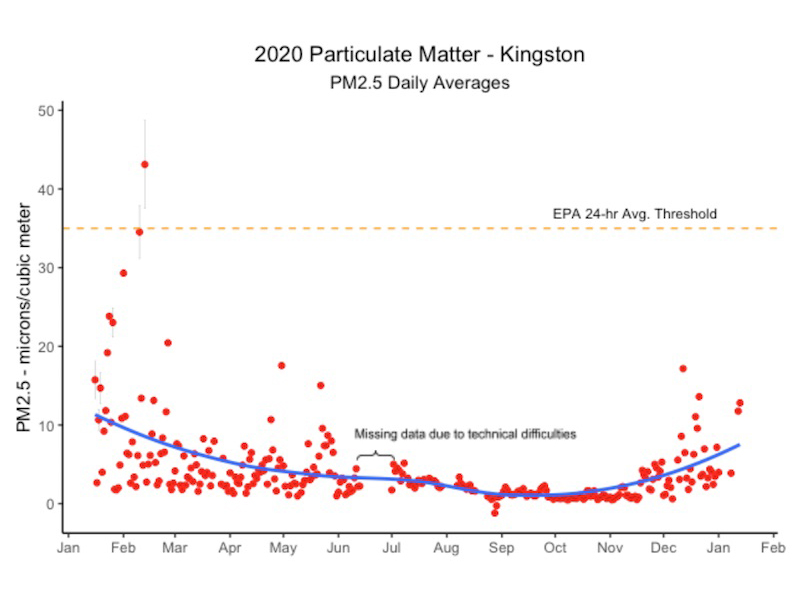
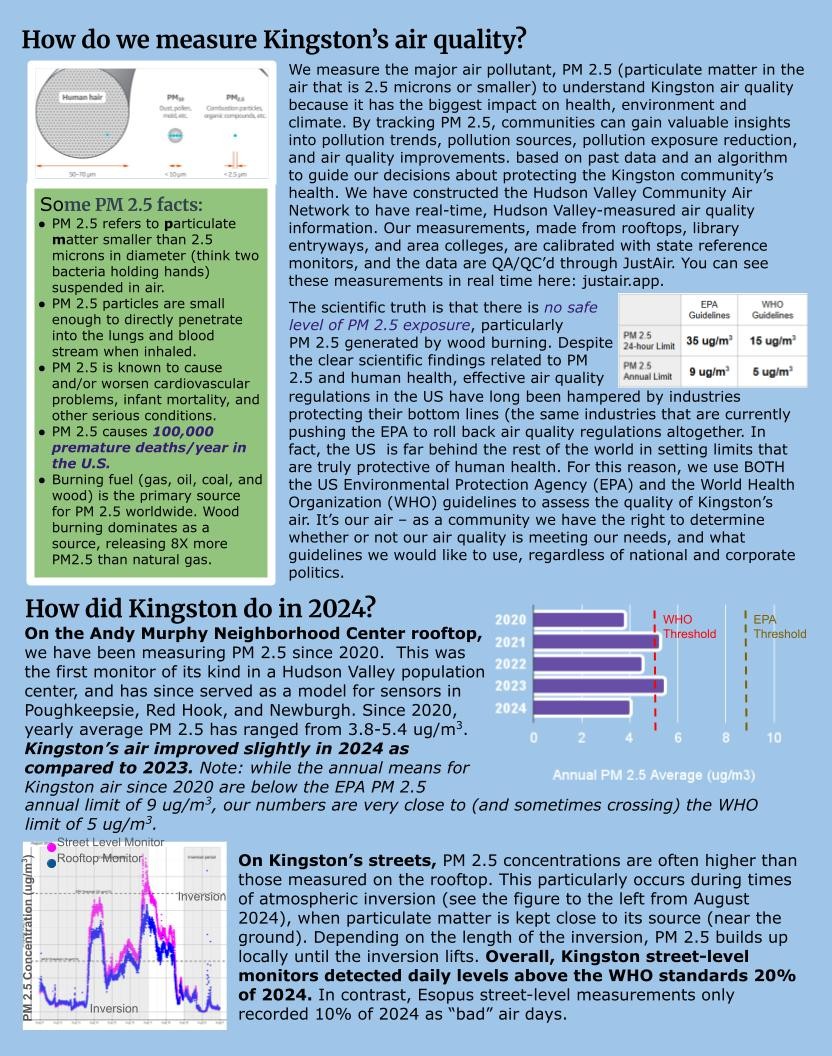
Particulate matter (PM) is defined by the EPA as “mixture of solid particles and liquid droplets found in the air,” manifesting in a variety of shapes and sizes. PM10 consists of particles ≤10µm while PM 2.5 consists of particles ≤2.5µm. Although some particulate matter commonly exists naturally in the air, such as pollen and dust, others such as soot, smoke, and other chemical compounds pose larger risks to both the environment and human health. We measure PM levels using data collected from a MetOne Ambient Particle Profiler installed on the roof of the Andy Murphy Center in Kingston, N.Y., as well as our network of Air Quality Eggs.
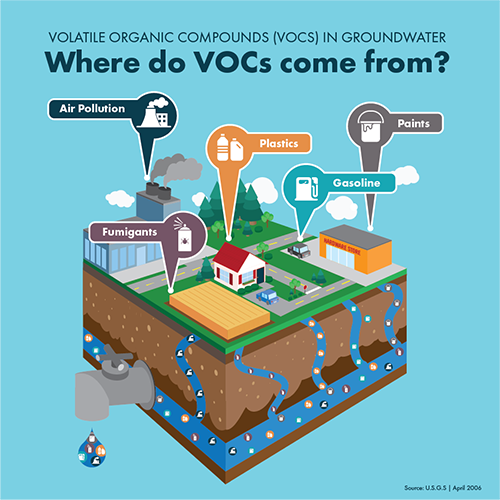
Volatile organic compounds (VOCs) are chemical compounds commonly found in paints, cleaning supplies, pesticides, refrigerants, and more. Emitted as liquids as well as gases, with a high vapor pressure and low water solubility, VOCs can easily be aerosolized and actively pose a threat to the environment and human health. VOCs play a significant role in the formation of ground-level ozone (more commonly known as smog) as well as act as a contributor to some forms of acid rain. Higher VOC counts have been observed indoors, due to their sources being common household items, where they have a higher chance of affecting residents.
A handful of our Air Quality Eggs measure VOCs specifically and are in use both in outdoor and indoor locations.
Ozone (O3) is a gas compound that is both naturally occurring and man-made. Commonly found in the upper levels of the atmosphere, stratospheric ozone is crucial as it aids in protecting the earth from high levels of the sun’s harmful UV radiation. However, when found at ground level, ozone can be extremely dangerous. Ground-level ozone, commonly known as “smog,” is a secondary pollutant that forms when volatile organic compounds (VOCs) and nitrogen oxides (NOx) combine. If inhaled, ground-level ozone causes severe health issues, especially for high risk populations such as those with lung disease or asthma.
In addition to measurements taken by regional weather stations, a handful of our (those that do not measure VOCs) measure ozone specifically.
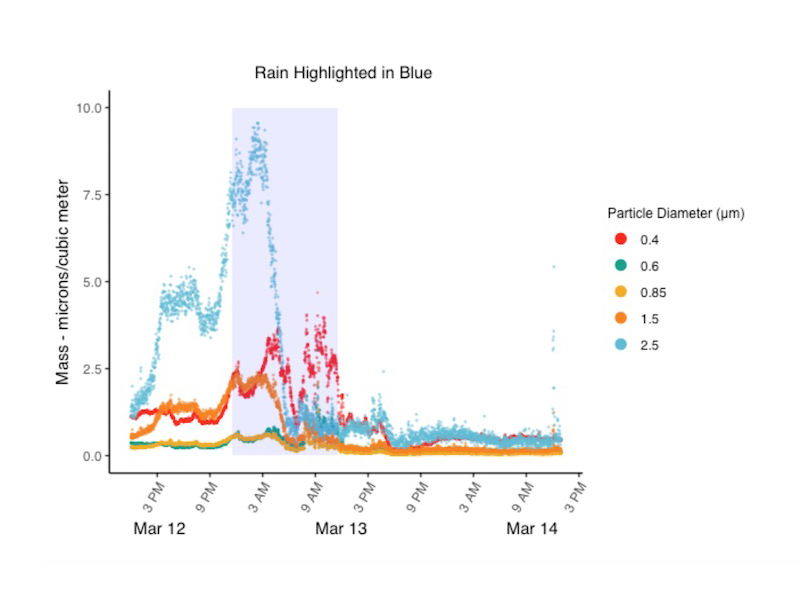
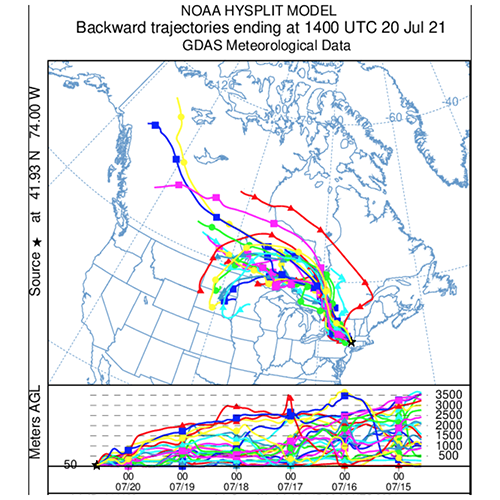 Meteorological data is an important factor when analyzing any air data results. Precipitation events, relative humidity, wind direction, and wind speed all have the potential to skew numbers. A large rain event causes the deposition of any large suspended particles in the air, pulling them to the ground within minutes. Additionally, wind speed and direction can easily pull contaminants such as PM, ground-level ozone, and VOCs out of the area in which they originated and into another area, where the sensors may pick them up. Because of this, past weather data is used for comparison from a regional weather station in Newburgh, N.Y., serving as a natural condition under which spikes in contaminants may be seen. The difficulty with meteorological data is that if air particles are coming from another area downwind, finding their direct source proves to be more difficult.
 As a longtime teacher, Lorraine Farina began noticing that woodsmoke from neighboring homes and businesses was infiltrating school buildings, affecting students’ and teachers’ health and well-being. When she experienced the same phenomenon at home in Kingston after retiring, she embarked on a journey that involved deep research into the subject as well as visits to the City of Kingston’s Conservation Advisory Council to begin to raise awareness and seek solutions. Lorraine became a CAC member, served for six years, and became chair of its Air Quality Subcommittee. After noticing an article about Bard College’s Center for Environmental Sciences and Humanities and its air-quality work, she contacted Dr. Elias Dueker. This initial contact led, eventually, to the formation of KAQI.
 Owen O’Connor is a Kingston resident with a background in building energy, residential construction, and farming. He is currently studying computer science and expanding his programming and data-wrangling skills. Owen is excited to be helping KAQI with its R programming needs.