
KINGSTON, NY – The Center for the Environment Sciences and Humanities at Bard College is pleased to announce the findings of the Kingston Air Quality Initiative (KAQI) after its first two years of research and data collection, as well as the availability of a new dashboard so that people in Kingston can access real-time information about their air quality.
KAQI began in January 2020 as a partnership between Bard’s Community Science Lab and the City of Kingston Conservation Advisory Council’s Air Quality Subcommittee to conduct a first-ever Kingston-centered air quality study. Since then, Kingston residents and Bard College students, staff, and faculty have conducted air quality monitoring in both indoor and outdoor environments.
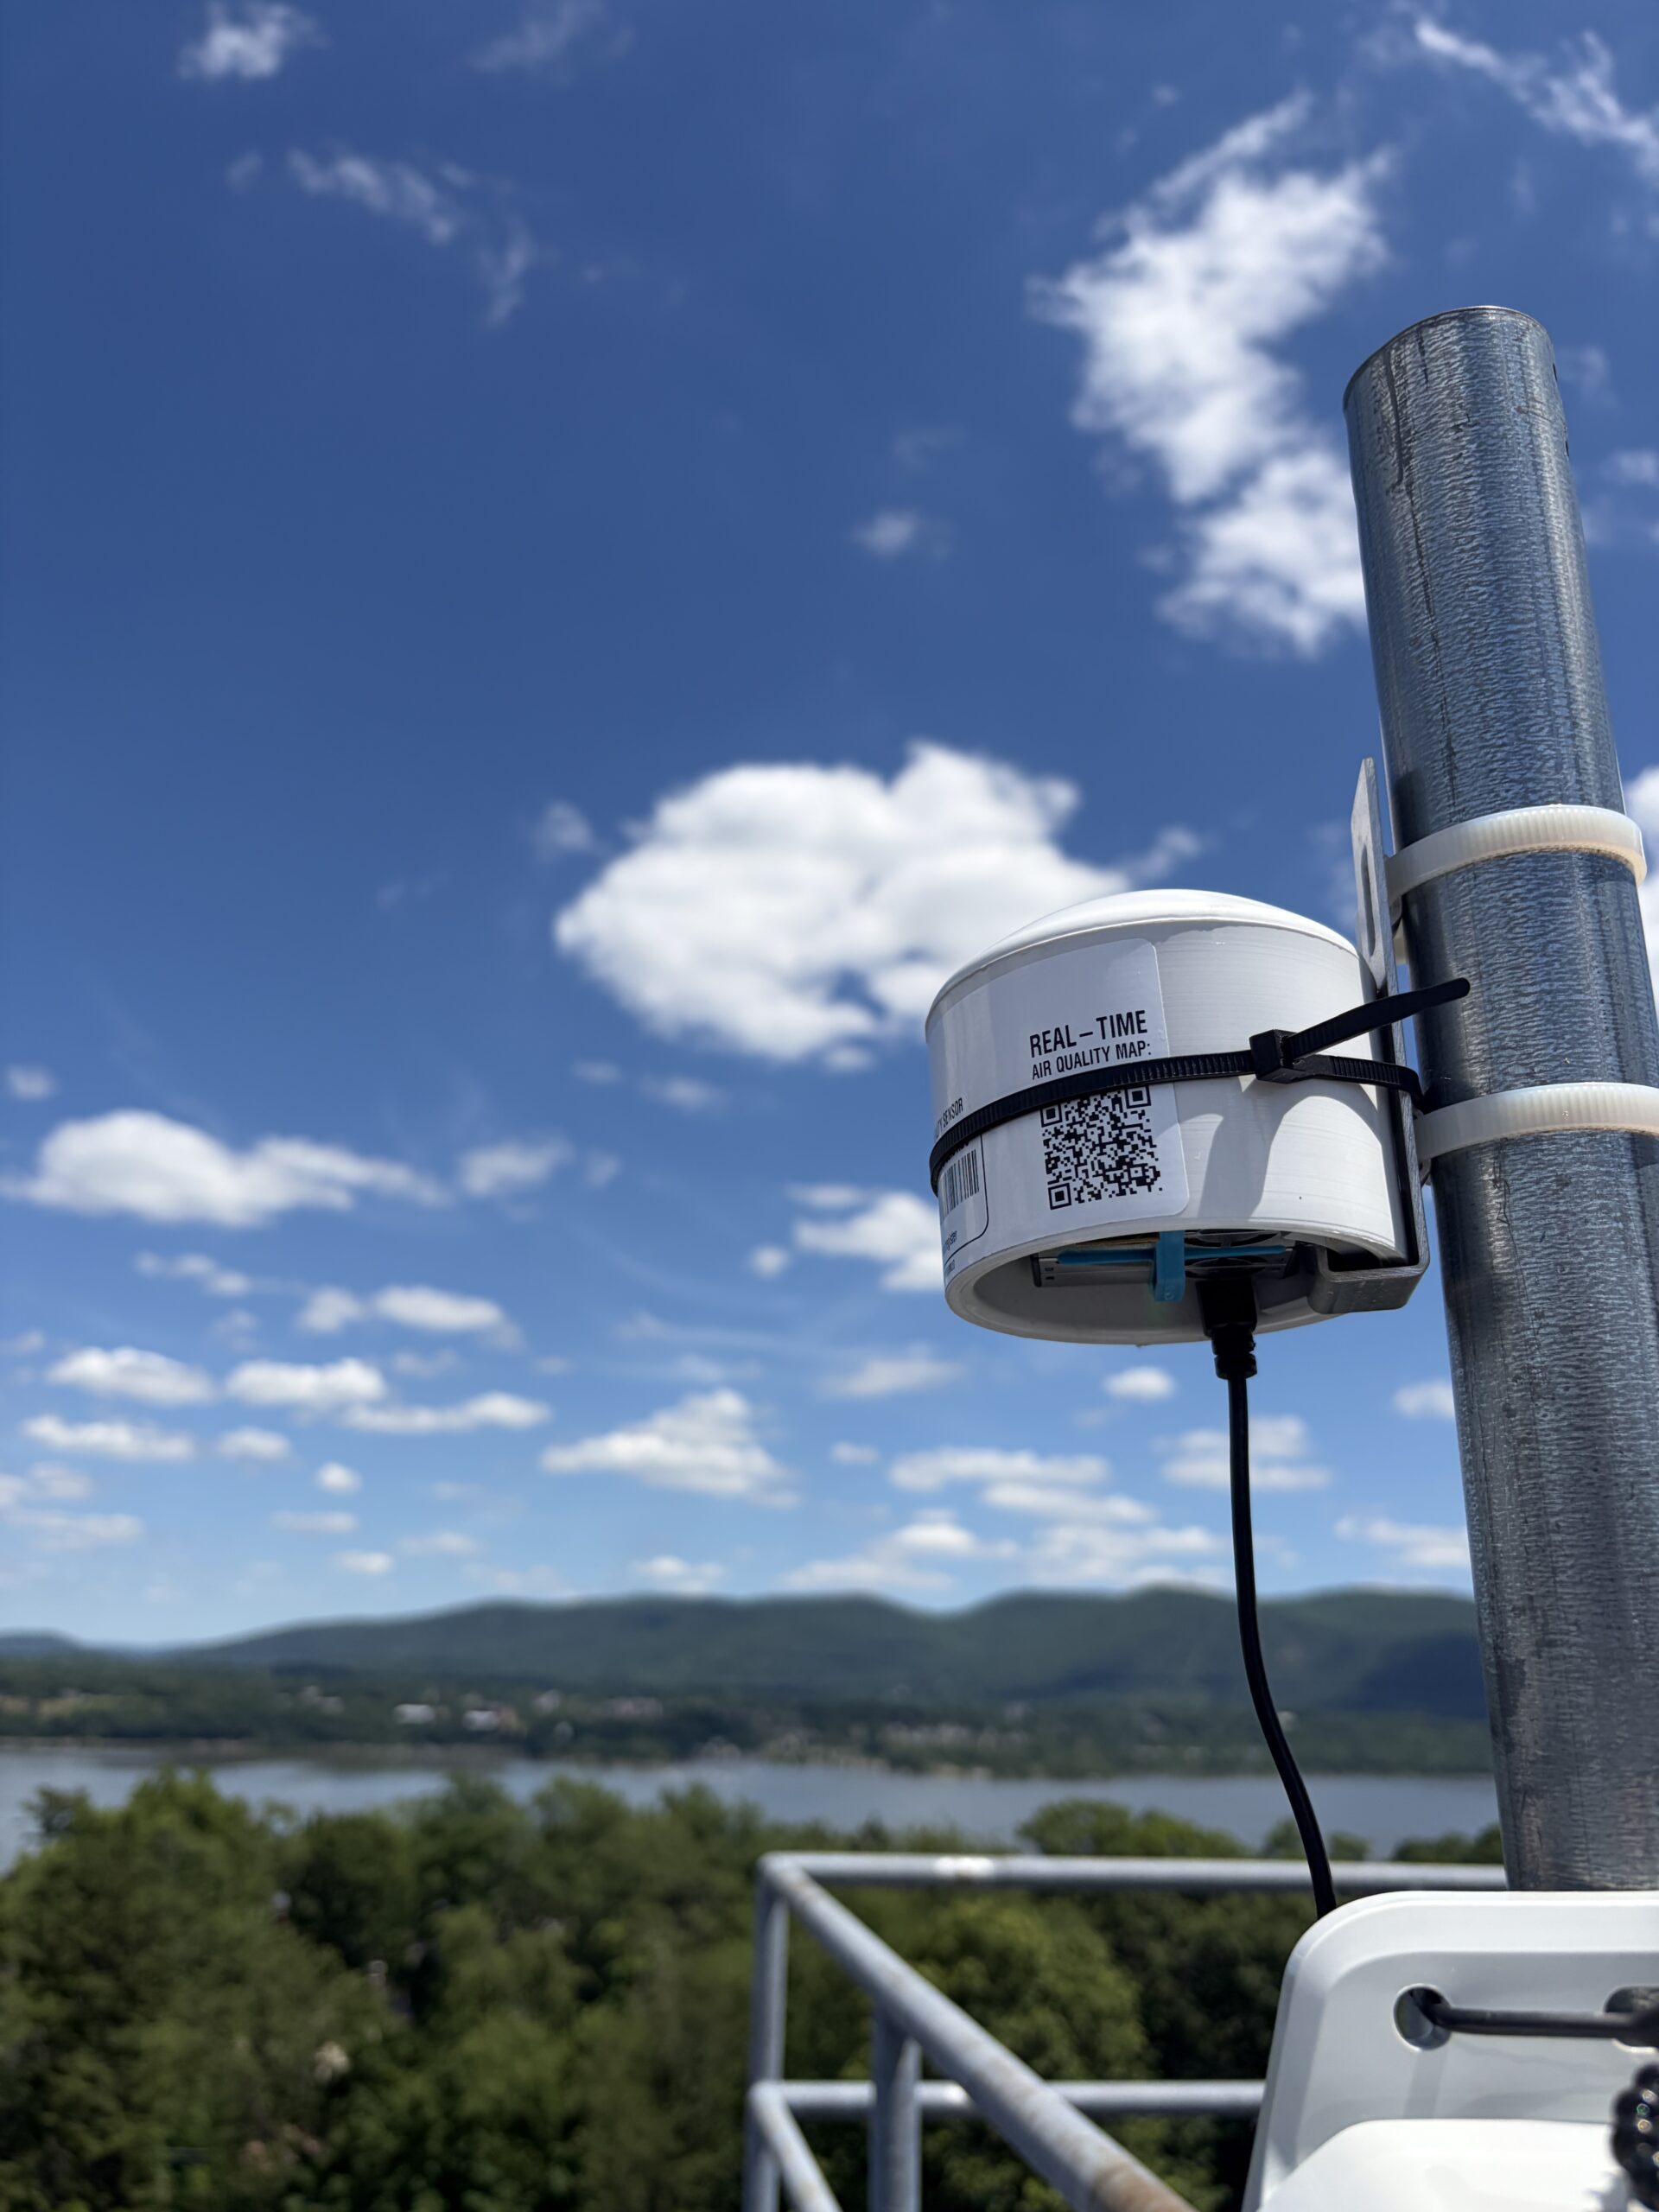
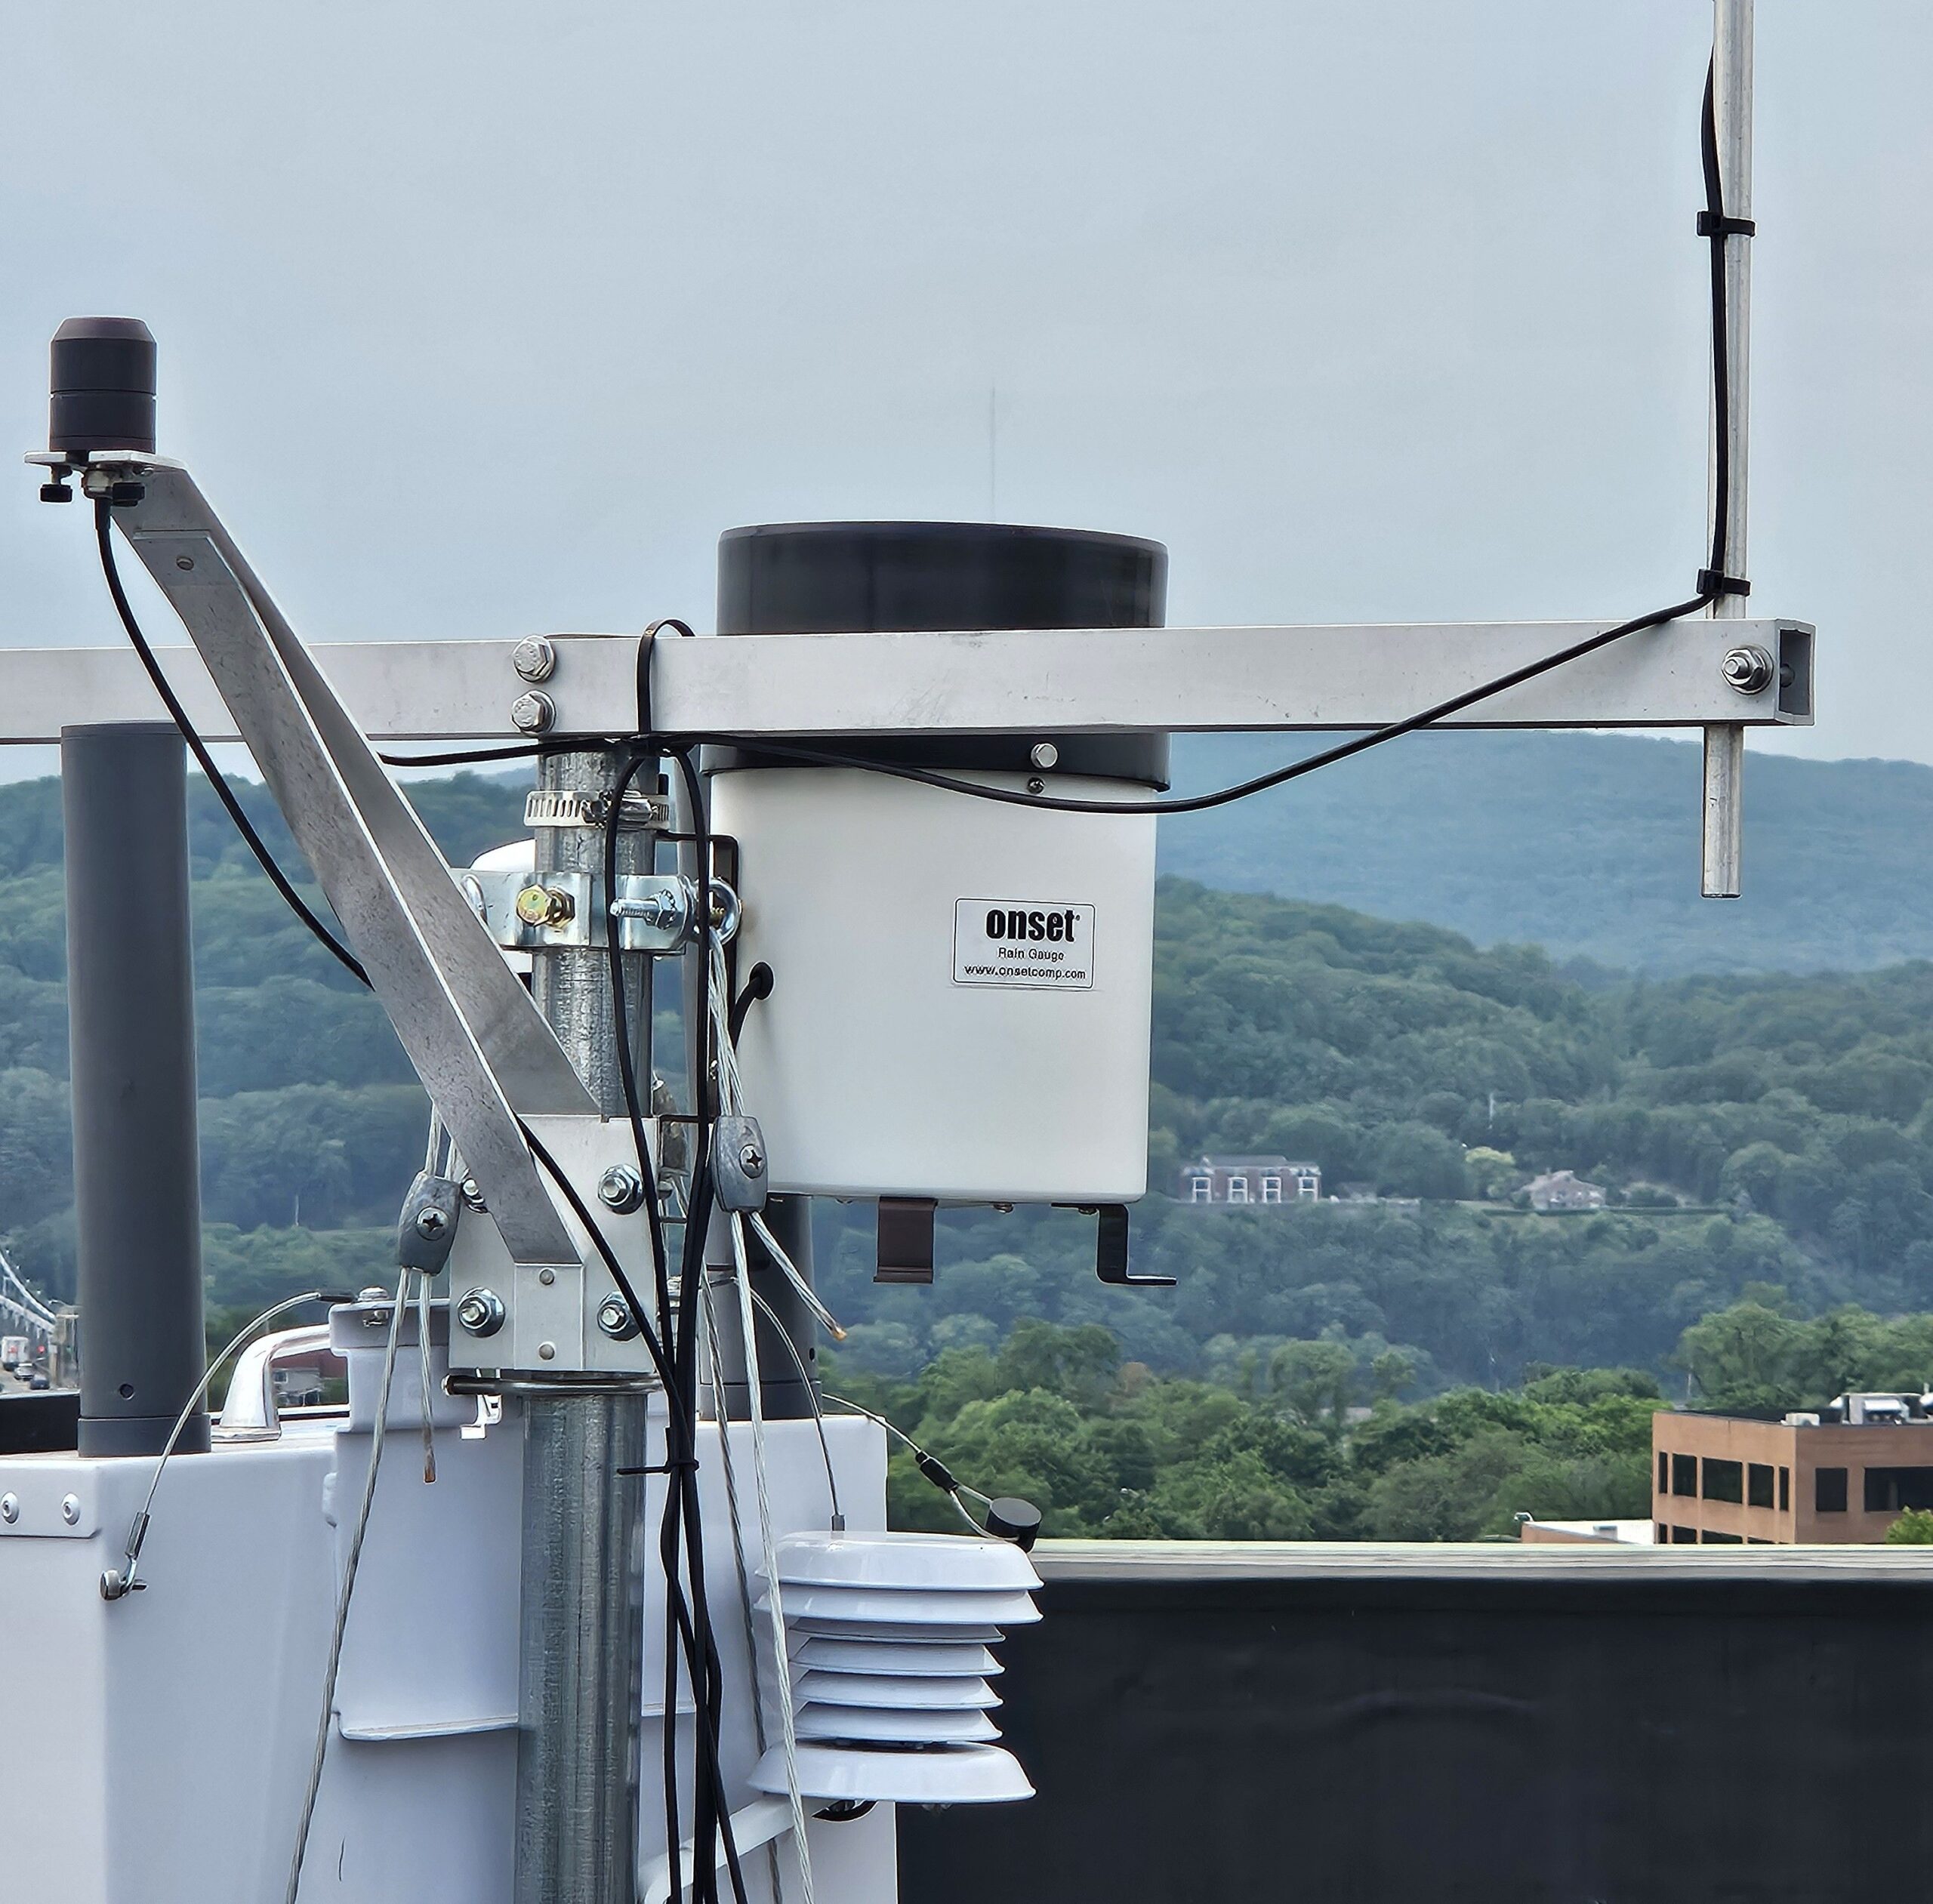
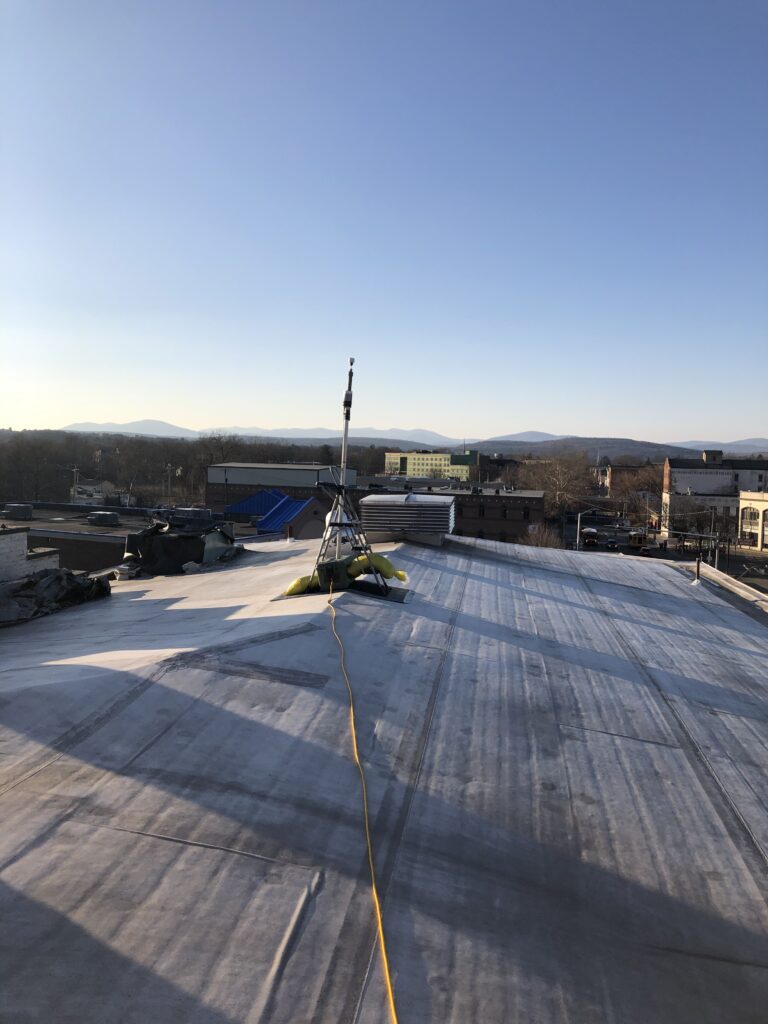
KAQI’s main monitoring efforts focus on a regional assessment of air pollution from fine particulate matter (PM2.5), as measured from the roof of the Andy Murphy Neighborhood Center on Broadway in Kingston. PM 2.5 is made up of microscopic particles that are the products of burning fuel, and is released into the air through exhausts from oil burners, gas burners, automobiles, cooking, grilling, and both indoor and outdoor wood burning. PM 2.5 particles are so tiny, they stay suspended in the air for long periods of time, allowing them to travel long distances before depositing. When these particles are inhaled, they can enter the bloodstream through the lungs, creating or exacerbating health issues. The World Health Organization (WHO) states that “Small particulate pollution has health impacts even at very low concentrations – indeed no threshold has been identified below which no damage to health is observed.
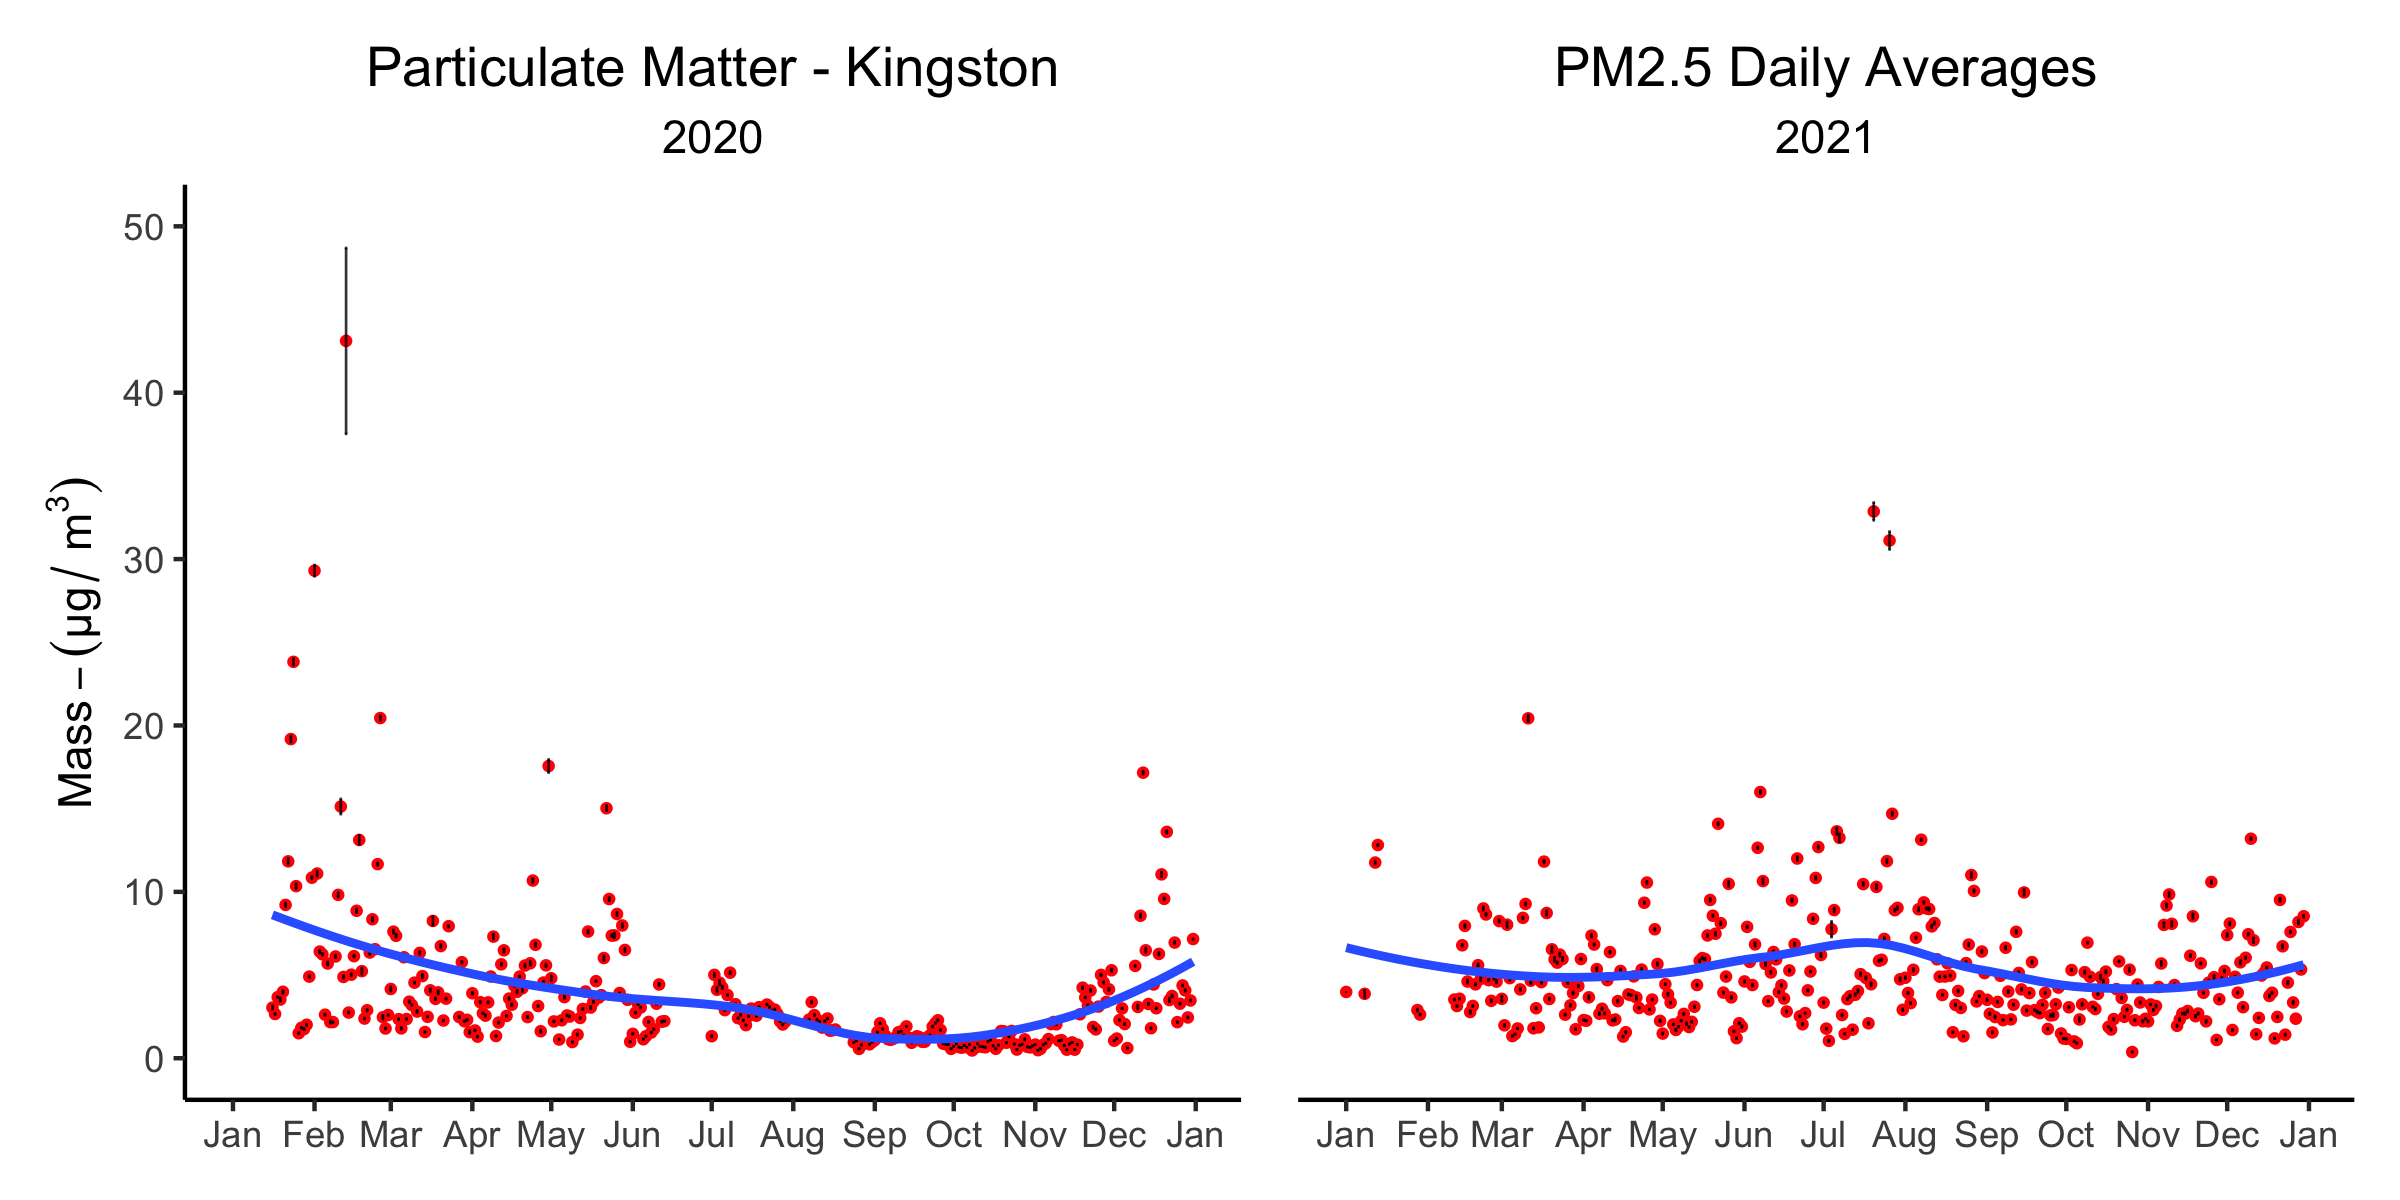
These figures demonstrate daily pm2.5 averages for 2020 and 2021. Each point represents a single day, with vertical lines representing the range of variation in hourly readings that day (if no vertical line visible, the variation was smaller than the graphic point). The blue line provides a smoothing line to give a sense of seasonal trends.
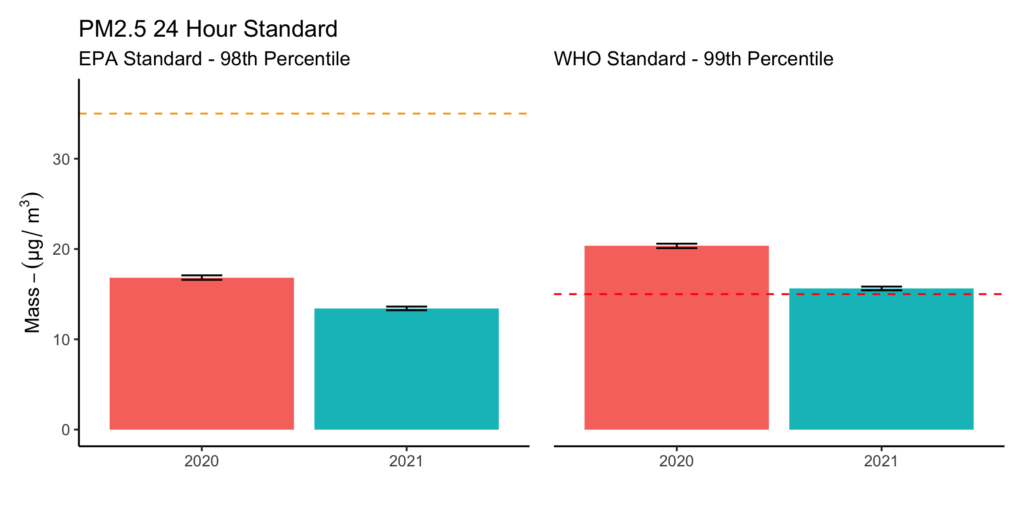
Two important measures of PM2.5 air quality are the annual mean standard, and the 24-hour average standard. For the period of measurement, Kingston met both the Environmental Protection Agency’s (EPA) and the WHO’s annual mean standard. While the city was well beneath the EPA’s standard, it was much closer to the WHO’s stricter standard. For the 24-hour standard, Kingston met the EPA’s criteria, but was over the WHO’s tougher 24-hour standard. For context, 99% of the world’s population was living in locations that do not meet the WHO’s air quality standards as of 2019.
Long term trends can only really be evaluated on a multi-year time scale. These first two years of monitoring will provide a baseline for KAQI’s monitoring efforts in the next few years, and allow them to assess how Kingston particulate matter pollution levels are changing over time.
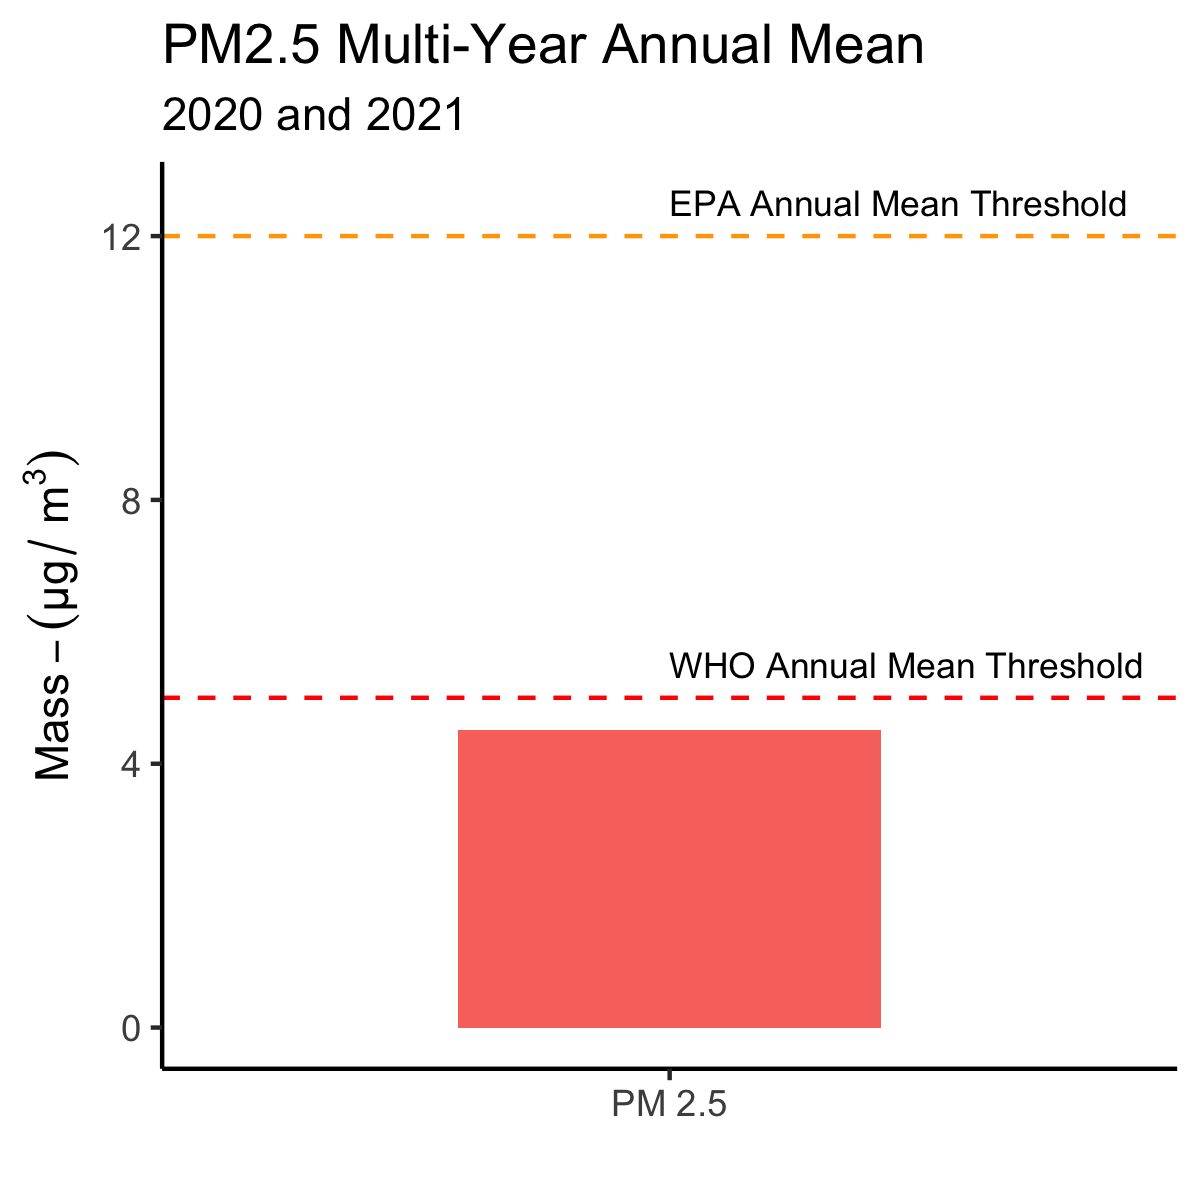
This figure shows the annual mean from 2020 and 2021, averaged together to compare to the Annual Mean standard for the EPA and the WHO. Kingston has been substantially below the EPA’s standard number for the period of measurement, but is only a little bit below the more conservative WHO target.
You can see these findings and more detail at the Center for the Environment Sciences and Humanities website: HERE
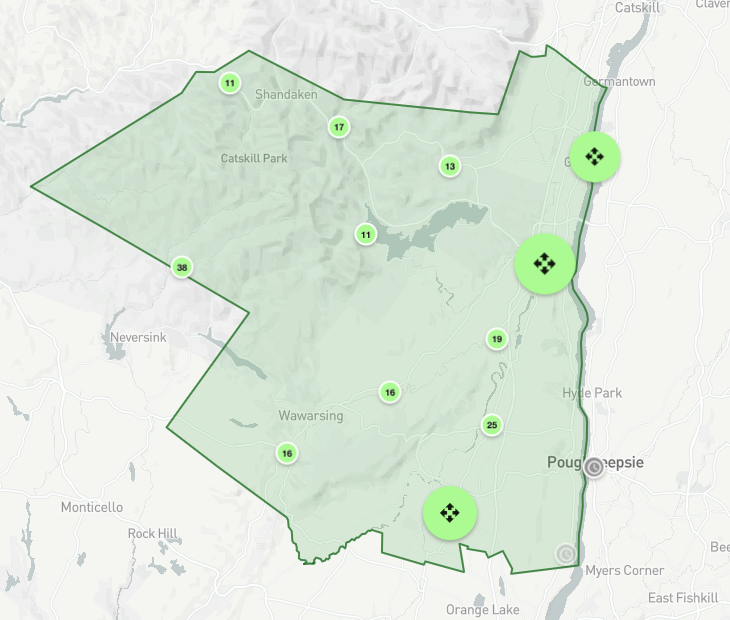
The Center for the Environment Sciences and Humanities at Bard College, in collaboration with KAQI, has developed a dashboard that allows Kingston residents to access real-time information about their city’s air quality. The current PM2.5 and PM10 conditions are shown and interpreted, and one can see the air quality sensor’s reading from the past 12 hours. A separate page allows users to explore the hourly readings of particulate matter from the whole Andy Murphy Neighborhood Center dataset.
The dashboard can be found at: https://tributary.shinyapps.io/AMNC_live/
“KAQI is an important model for ways that academic institutions can contribute concretely to the communities who surround and support them. We are combining serious efforts to monitor long air quality in Kingston with tools that allow us to put the data in front of residents in real-time and give them feedback about what is going on in their city today.”
Eli Dueker, Director of Bard’s Center for the Environment Sciences and Humanities
“This Kingston Air Quality Initiative monitoring project is such an important step that Kingston is taking toward assuring that its residents will breathe clean air into the future. This project responds to the need for both regional and neighborhood monitoring so that all residents’ air quality is taken into account. That the initiative focuses on PM 2.5 is especially important”
Judith Enck, Former EPA Regional Administrator
“As we know, air quality can have significant impacts for respiratory infections, heart disease, stroke and lung cancer, and more severely affects people who are already ill. We applaud the work of the Center for Environmental Science and Humanities at Bard and thank them for their work here in Kingston. Through the Kingston Air Quality Initiative dashboard, the Bard Center for the Environment Sciences and Humanities has provided a valuable tool to the City of Kingston and its residents: the ability to assess the health hazards posed by air pollution in real-time.
Emily Flynn, City of Kingston Director of Health and Wellness
"The long-term trend data recorded will be a resource for decision makers to see the patterns of air quality within the city and to understand the impacts of local changes on air quality.”
Nick Hvozda, Interim Director of the Ulster County Department of the Environment
Over the course of 2021, multiple factors could have contributed to higher PM2.5 counts in the summer. One of these potential factors encompasses pollutants associated with smoke sourced from wildfires on the West Coast. Known pollutants attributed to wildfires include carbon monoxide (CO), nitrogen oxides (NOx), ozone (O3), volatile organic compounds (VOCs), particulate matter (PM), and black carbon. Kingston residents, as well as those throughout the greater Hudson Valley area, observed blankets of smoke at ground level the week of July 14th (www.kingston-ny.gov/wildfires). Although it is difficult to prove that the higher PM2.5 counts seen in July of 2021 were caused by wildfire smoke that had migrated across the country to the Hudson Valley, it is an important contributor to keep in mind, especially with the increasing potential for wildfire seasons to increase in length and intensity in the coming years due to the effects of climate change.
For more information or ways to get involved, visit
kingston-ny.gov/airquality
cesh.bard.edu/kingston-air-quality-initiative-kaqi/
Additional resources:
Particle Pollution
Even Low Levels of Soot Can Be Deadly to Older People, Research Finds
Ambient (outdoor) air pollution
Post Date: 03-29-2022