


What does my JustAir air quality data mean?
Thank you for subscribing to justair.app. Air quality matters because it directly impacts our health, environment, and quality of life. You subscribing to air quality alerts via justair.app is an important step to understanding and acting on your air quality.
As you begin, here are some things to know about this platform and air quality data:
1) After I subscribe, what should I look out for?
2) Air Quality Index (AQI) scale
The Air Quality Index (AQI) is a standardized and color-coded system developed by the Environmental Protection Agency to measure and communicate the quality of the air. AQI is calculated based on the concentrations of major air pollutants over a certain time frame and ranges from 0 to 500, with lower values indicating better air quality and higher values indicating poorer air quality. For more information, visit: https://www.airnow.gov/aqi/aqi-basics/
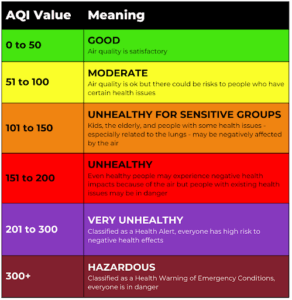
3) How do I make sense of the AQI readings?
The AQI scale is a useful tool, but it is also good to remember that:
AQI is calculated using an average of multiple hours of data. The goal of AQI is to indicate health risk, which increases as exposure to pollution increases over time. So the AQI is not literally the latest reading; it is the level of risk you’ve been exposed to recently.
Conditions can change quickly enough that the displayed color and reading may not reflect the air in a single moment, but it may indicate the conditions you are still being exposed to. We are working on ways to better predict air quality to help you plan your day.
4) How do automated text alerts work?
After creating an account on the JustAir dashboard, you can sign up to get air quality safety alerts by subscribing to specific monitors. To do this, click the ‘heart’ icon next to the monitor. You’ll receive a ‘Welcome to JustAir’ text message when your registration is complete. You also get signed up to receive occasional custom text messages from your local air quality organization informing you of any major updates.
Once any monitor you follow reaches a level of concern, you’ll be notified via text. You can choose your own threshold in your account’s ‘Profile’. For example, if you want to be notified when AQI reaches “Unhealthy” you can toggle on this level. If you do not choose a threshold, the sponsoring organization’s default setting is used.
You can visit the ‘My Monitors’ tab to see which locations you follow are measuring poor air quality and you’ll receive a notification once all of the air quality monitors you follow return to a ‘healthy’ AQI reading.
Please note, we only send text messages out between the hours of 7:00 am and 9:00 pm ET and they will only be sent on the half-hour mark. We want you to stay informed on air quality but we also don’t want to overwhelm you with multiple messages for every monitor you follow. You can always check justair.app to get the most up-to-date air quality readings!
5) If I get a text alert, does that mean the air is bad?
It may. We have advanced tools to let us know if the sensor is malfunctioning, and these should catch most instances. Still, it is possible that an alert is triggered in error due to a malfunction. It is important to note that the reading can also be inaccurate due to weather conditions that confuse sensors (for example, fog).
If you receive an alert that seems unusual, check surrounding monitors on justair.app to see if they show a consistent level. Here you will also see any banner alerts about unusual trends.
6) Data: how do I get it, and what does it tell me and not (necessarily) tell me?
Downloading data. Anyone can download air quality data from any monitor within a 24-hour or 30-day period. When you’re in the JustAir dashboard, click on a monitor and tap the ‘Download’ button next to the graphs. If you’re looking for more extensive air quality data in your community, contact us at [email protected] and we’ll process your request for data.
What it can tell you. Data downloaded from justair.app can tell us important information, especially when combined with personal experience and community knowledge. For example, dust or pollution from a known source in a neighborhood. It can provide averages over time; it can indicate serious events, such as wildfire smoke; it can indicate consistent good air. With enough data, it can also reveal trends.
What it doesn’t (necessarily) tell you. It is natural to expect data to contain answers. Most of the time however, answers come from months or years of collection and analysis with advanced tools. It is important that personal experience and community knowledge inform data analysis. There are exceptions, like a localized fire, but without careful analysis, it is difficult to use data and AQI alerts to pinpoint exactly where pollution is coming from. Furthermore, AQI and most collected data doesn’t tell us anything about pollutants that the sensors do not measure. Most monitors only measure certain pollutants, and they can only indicate these pollutants, for example most monitors do not measure gasses.
7) Why do I see irregularities with monitors I’m subscribed to?
Gaps in data. Unfortunately, air quality monitors malfunction. Think of how often a printer gets jammed or doesn’t print properly—bugs and jams are a fact of all hardware and software devices and air quality monitors are no different. If there is a gap in the data on a monitor you follow, it means there was a minor malfunction that has been taken care of and the monitor is back online collecting data.
Gray monitors. If a monitor is grayed out on the JustAir dashboard and not giving a current reading, it is currently under maintenance. This means a network manager is aware of the issue and working to restore the device so it can be back up and running soon. Sometimes this is a quick fix and the monitor comes back online right away. Other times it can take a few weeks to diagnose and solve an issue. On rare occasions, we have to replace a monitor so it takes additional time. We know this can be frustrating. We are always working to reduce data gaps.
8) What do I do when there is poor air quality?
When you get a text alert indicating poor air quality, it can be helpful to visit justair.app for additional information about how widespread this might be. Remember, too, that Unhealthy, Very Unhealthy, and Hazardous readings can often be confirmed by your senses: sight, eyes, nose, and even lungs. And that AQI over 100 can be unhealthy for kids, the elderly, and people with health conditions, especially related to the lungs.
During periods of poor air quality, it`s crucial to prioritize your health and take necessary precautions to ensure the safety of themselves and their families. Personal decisions regarding health management vary from person to person. Some may find it beneficial to stay indoors, keep kids home from outdoor sports practice, wear a mask, or keep necessary medications on hand, particularly if they have conditions such as asthma.
JustAir has outlined several measures individuals can take to safeguard their well-being during times of compromised air quality in an article. Check it out: