Community air quality
information guide
This air quality guide was created by the Community Sciences Lab at Bard’s Center for Environmental Sciences and Humanities to inform communities on the impacts of air quality in our daily lives. It supplements data collected by the Hudson Valley Community Air Network and reported in our Community Air Quality Reports.
new york state's green amendment
In November of 2021, New York became the third state in the US to add a Green Amendment to its state constitution. The amendment declares that, “Each person shall have a right to clean air and water, and a healthful environment.”
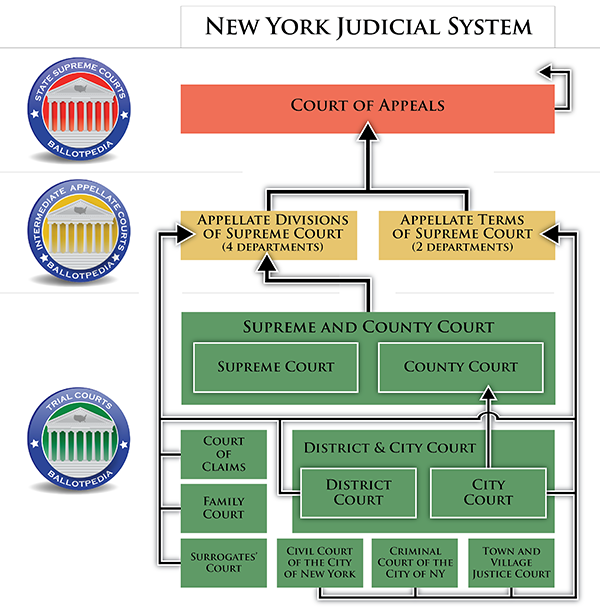
Because it is a relatively new addition to New York State law, every case that goes through the NYS court system can have a major impact on environmental law and the meaning and interpretation of the Green Amendment.
The experts at the Environmental and Climate Justice Clinic at Morningside Heights Legal Services in New York City (Columbia Law) discuss the history of the Green Amendment and how, since its implementation, court cases have affected interpretation of the Green Amendment. Check out this short, but important article here: Early Litigation Under New York’s Green Amendment.
what do i do when air quality is poor?
Ways you can protect yourself and others when air quality is poor:
- Stay indoors and close windows
- Reduce strenuous outdoor activities
- Wear an N95 mask when outdoors
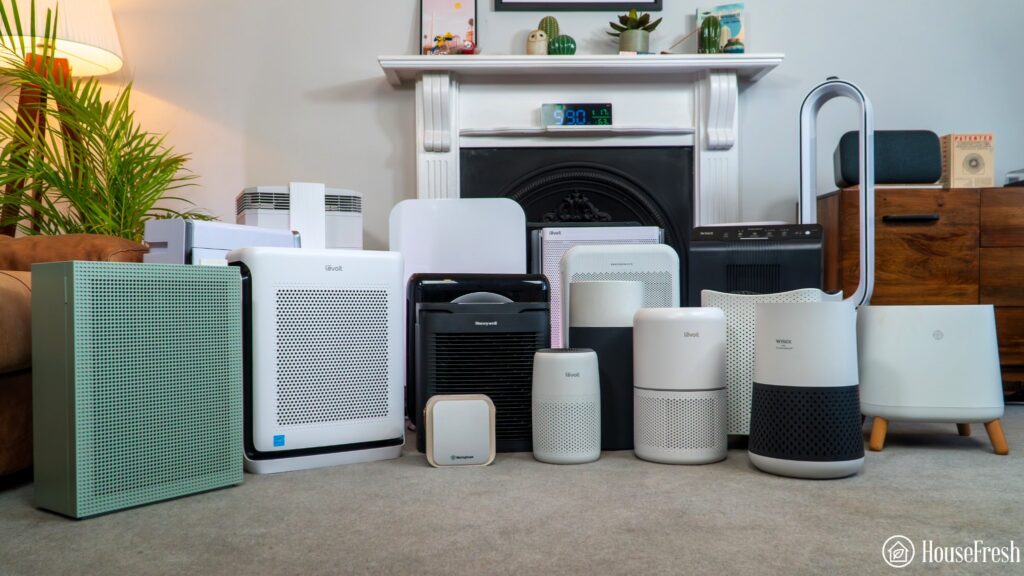
- Use air purifiers indoors
- Make a low-cost option: Corsi/Rosenthal box
- During the summer months: use central A/C if you can or use a room A/C on the “recirculate” setting
Know your air quality rights
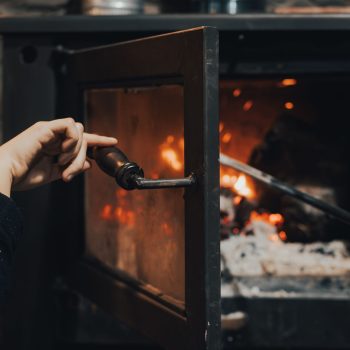
What are the relevant federal, state and local laws for the regulation of indoor and outdoor wood smoke pollution in New York’s Hudson Valley?
What limits are set under law and what enforcement mechanisms exist?
Learn more about the answers to these questions in “Know Your Rights: Guidance for Wood Smoke Pollution“ written by the Environmental and Climate Justice Clinic at Morningside Heights Legal Services (Columbia University).
how do i get real-time updates on my local air quality?
To get live, real time email or text alerts from a Hudson Valley air quality sensor near you, scan the QR code to sign up on JustAir (or visit justair.app). Click create an account, enter your contact information, find and favorite the local sensor you want to receive air quality alerts from. You will receive a notification when air pollution levels are high in your area, and another once the air pollution has dissipated.

how do we measure air quality?
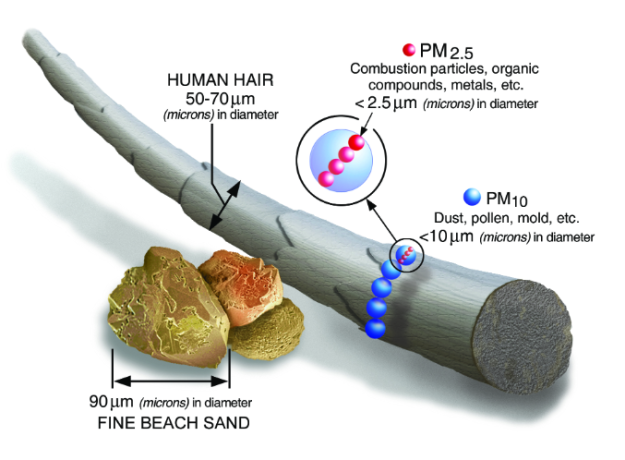
To evaluate air quality, we measure the amount of particle matter smaller than 2.5 micrometers (PM2.5). That’s about one ten-thousandth of an inch!
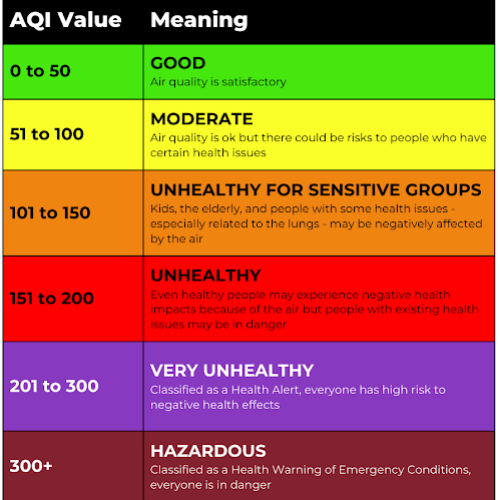
PM2.5 is measured in micrograms per cubic meter (µg/m3) of air. The amount of particulate matter in the air is measured by our sensors, then converted into an Air Quality Index number to make air quality easier to understand. The Air Quality Index quantifies different thresholds and their related air quality impacts on human health.
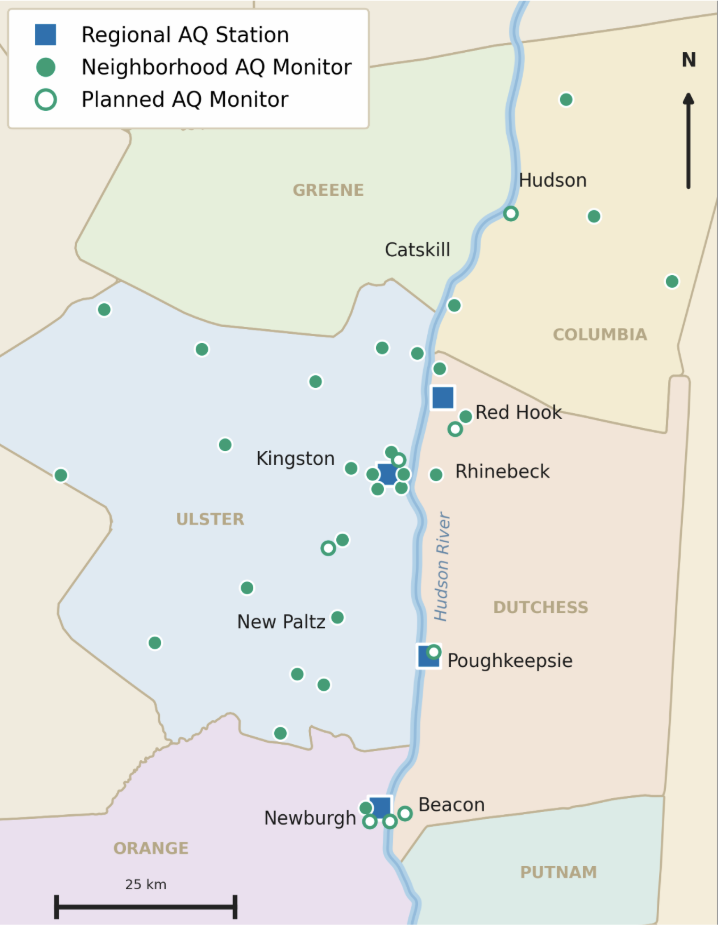
We collect PM2.5 measurements from air quality sensors located at ground-level and on rooftops. Our sensors are hosted at libraries, colleges, and municipal buildings in Columbia, Dutchess, Orange, and Ulster Counties.
Why should I care about pm2.5?
When you breathe in PM2.5, it can pass directly through your lungs and into your blood. From there, it makes its way to every other part of your body—including the brain.
On top of that, PM2.5 isn’t made of just one material. It can come from and be made of anything! Common sources include smoke, vehicle exhaust, cooking, and construction. Because of this, PM2.5 has the biggest potential impact on health, and can have very different effects depending on the source.
It also significantly impacts our climate and ecosystems—and can provide insights into pollution trends and pollution sources.
what are the current guidelines for pm2.5?
The truth is, there is no safe level of PM2.5 exposure. Any amount can have a negative impact on our health and environment. However, organizations such as the United States Environmental Protection Agency (US EPA) and the World Health Organization (WHO) have set guidelines to help communities and individuals make more informed decisions about their exposure. The US EPA recommends that your average daily PM2.5 exposure not exceed an AQI of 50. They also recommend that no more than 7 days out of the year exceed an AQI of 99. The WHO recommends that your average daily PM2.5 exposure not exceed an AQI of 28. They also recommend that no more than 4 days out of the year exceed an AQI of 62. You may notice a large difference here! The US EPA has set much more lax limits on PM2.5 exposure. Ultimately, it’s our air—we have the right to determine whether or not our air quality is meeting our community’s needs.
What about woodsmoke?
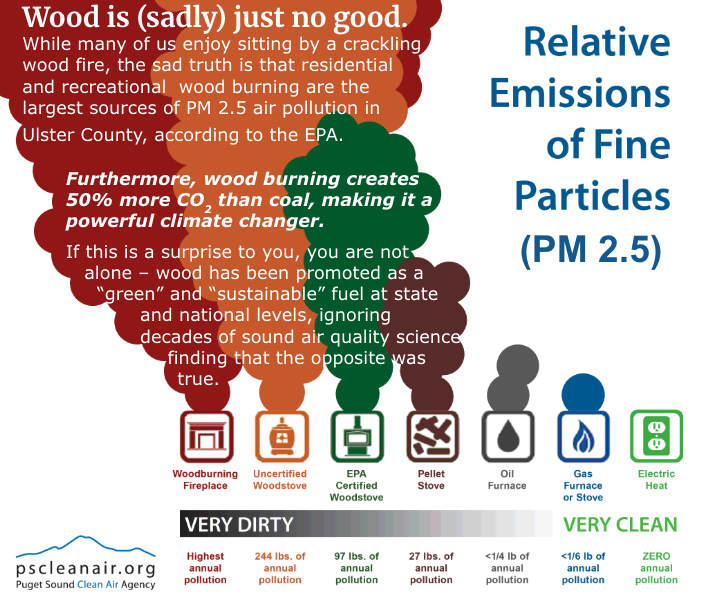
Woodsmoke is more damaging to the human body and more environmentally polluting than any other fuel source per unit of mass burned, including gas, oil, and even coal.*
- It has been shown to be more cancer-inducing than other sources of PM 2.5, such as vehicle exhaust.
- Woodsmoke is 30 times more potent at inducing tumors than cigarette smoke.
- If that wasn’t bad enough, just one fire ring produces as much PM2.5 as 800 cigarettes!
Woodsmoke is more damaging to the human body and more environmentally polluting than any other fuel source per unit of mass burned, including gas, oil, and even coal.*
how do we determine sources of pollution?
- When different fuel sources are burnt, they produce different chemical “fingerprints” that we can trace in the air.
- The two most important indicators we use to determine pollution-sources are Brown Carbon and Black Carbon. These are the major components of soot.
- When you burn wood or other fresh plant-matter, it releases more Brown Carbon than Black Carbon.
- When you burn fossil fuels like oil or coal, they release more Black Carbon then Brown Carbon.
- Because different fuels produce different amounts of Brown and Black Carbon, we can use these pollutants to look at the relative differences in wood and fossil fuel burning.
how much of our pollutions is woodsmoke?
- Kingston has lower levels of carbon pollution in the air than more urban areas of New York.
- However, when comparing the levels of brown and black carbon, we can see that a much larger proportion of Kingston’s carbon pollution is brown.
- This indicates to us that Kingston’s air pollution is more driven by burning wood than fossil fuels.
how can we do even better moving forward?
It’s easy to feel like air pollution is out of our control, especially when wildfires can cause intense air quality emergencies. Our data show that Hudson Valley air quality is mainly impacted by local sources of pollution, and is thus largely under local community control.
This is especially visible in data from the 2020 COVID-19 shutdown, and in data from 4th of July celebrations. In 2020, our local air quality was the lowest we’ve seen yet. This is largely thanks to reduced vehicle usage as individuals left their homes less, and also due to a reduction in recreational wood-burning. Every year on the 4th of July, our air pollution levels skyrocket. These increased levels of pollution typically last until the next day, but sometimes persist for longer. So let’s exercise our power to improve our own air quality in real time! Here are some practical ways to do this:
- Reduce or end recreational wood-burning. Burning wood is one of the primary sources of PM2.5 in the Hudson Valley!
- Join a local interest group, such as the Hudson Valley Air Quality Coalition (HVAQ)! HVAQ is a group of community members who meet every fourth Thursday on Zoom to discuss community concerns and struggles with air quality issues, find solutions, and educate the public. They work on both indoor and outdoor air quality issues.
- Reach out to us to find out how you can support the Hudson Valley Community Air Network as we maintain our sensors and expand our network into new areas of the Hudson Valley
- And most of all, engage with local public officials to advocate for changes you want to see!
special thanks to our partners
A huge thank you to the current members of the Hudson Valley Community Air Network – public libraries and municipal partners supply and protect our community knowledge!
- The City of Kingston
- The Hudson Valley Air Quality Coalition
- The Hudson Valley Community Air Network:
- Adriance Memorial Library (Poughkeepsie)
- Andy Murphy Neighborhood Center (Kingston)
- Bard Stevenson Library
- Denning Town Hall*†
- Elting Memorial Library (New Paltz)†
- Esopus Public Library†
- Gardiner Library†
- Germantown Library
- Hurley Library†
- Kinderhook Memorial Library
- Olive Free Library*†
- Philmont Library
- Phoenicia Public Library
- Pine Hill Community Center*†
- Plattekill Public Library*†
- Red Hook Public Library
- Roeliff Jansen Community Library (Hillsdale)
- Rochester Town Hall†
- Rosendale Library*†
- Saugerties Public Library
- Starr Library (Rhinebeck)
- Tivoli Free Library
- Town of Ulster Library†
- Wallkill Public Library*†
- Wawarsing Town Hall†
- Woodstock Public Library†
- Outdoor Promise
- Ulster County
* Sites added in 2026
† Sites sponsored by Ulster County
Don’t see your library on this list? Talk to your librarian and have them contact us at [email protected].
the fine print
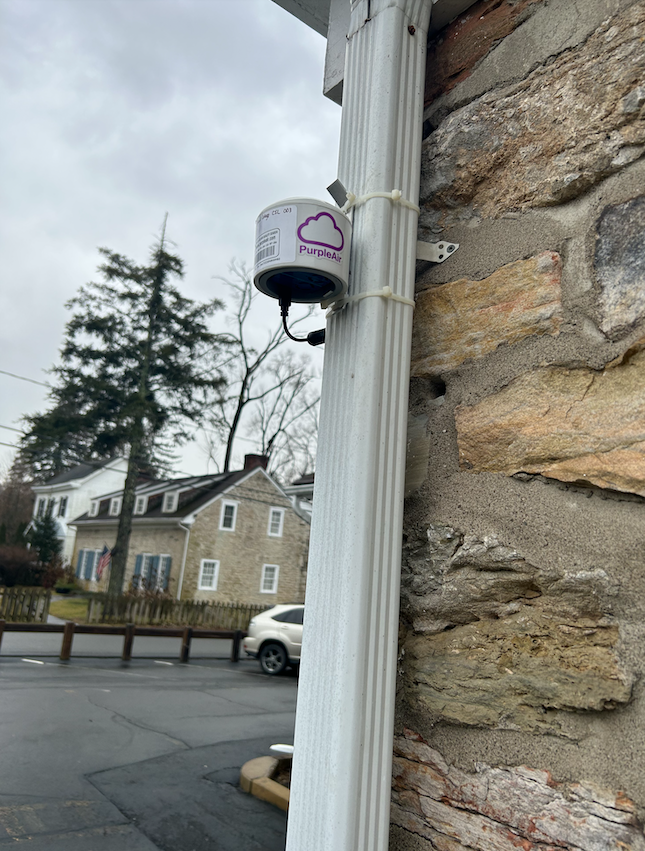
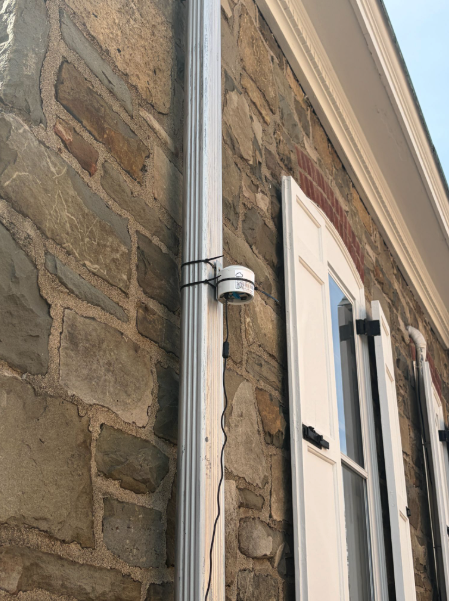
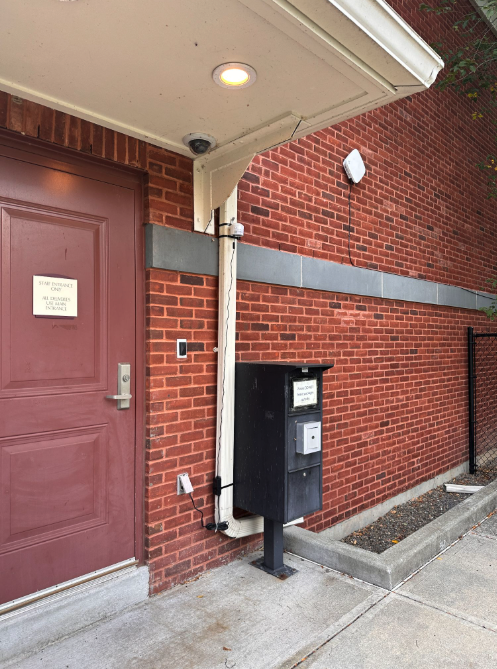
- Our regional air quality stations use data from QuantAQ ModulAIR monitors, and neighborhood data are supplied at ground-level by Purple Air monitors. Some Purple Air monitors were loaned to us by the EPA. Others were purchased by the CSL, Ulster County, or other municipalities.
- The data from these monitors are used for informational purposes, community action, and peer-reviewed research.
- If communities are able to identify high-pollution areas, public officials should then perform their regulatory mandates.